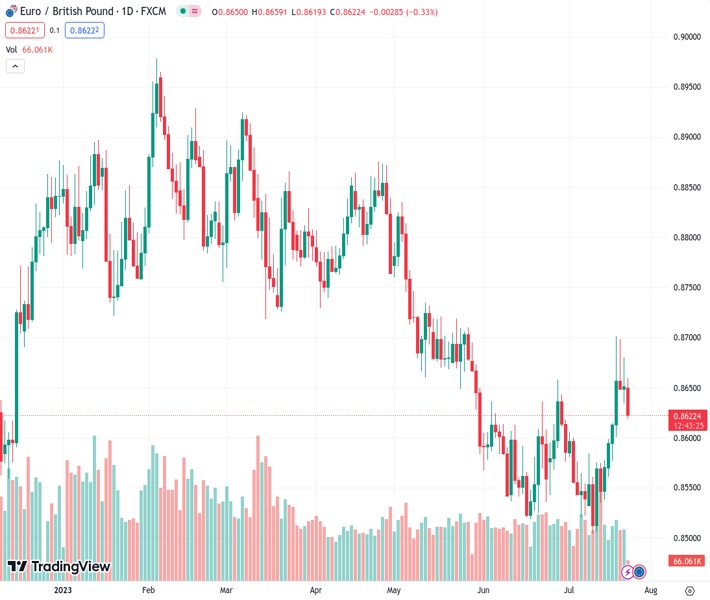
The EURGBP currency pair, trading at a rate of 0.86235, is experiencing significant resistance as a result of the poor Euro Zone Purchasing Managers’ Index (PMI) data for July.
…
This is a premium post.
[s2If !current_user_can(access_s2member_level4)]Please register for FREE REGISTER to read full post below containing analysis. In case of any error or you think you are not able to read the full post below, please email us at support#nehcap.com [lwa][/s2If] [s2If current_user_can(access_s2member_level1)]
- EUR/GBP meets with heavy supply in reaction to the dismal Euro Zone PMI prints for July.
The pair currently trades last at 0.86235.
The previous day high was 0.868 while the previous day low was 0.8634. The daily 38.2% Fib levels comes at 0.8662, expected to provide resistance. Similarly, the daily 61.8% fib level is at 0.8652, expected to provide resistance.
The EUR/GBP cross comes under heavy selling pressure during the early European session on Monday and drops to a three-day low, around the 0.8620 region in reaction to the dismal Euro Zone data.
The shared currency takes a hit following the rather disappointing release of Eurozone PMI prints, which, in turn, is seen as a key factor behind the latest leg of a sudden drop for the EUR/GBP cross. In fact, S&P Global’s preliminary report pointed to a sharp slowdown in business activity in France and Germany – the Eurozone’s two largest economies. Moreover, the composite Euro Zone PMI missed consensus estimates and eases pressure on the European Central Bank (ECB) to hike interest rates after the anticipated 25 bps lift-off later this week.
The EUR/GBP cross, however, manages to hold above the 0.8600 mark, at least for the time being, in the wake of diminishing odds for a more aggressive policy tightening by the Bank of England (BoE), bolstered by last week’s softer UK consumer inflation figures. Hence, it will be prudent to wait for strong follow-through selling before confirming that the EUR/GBP pair’s recent goodish recovery from the vicinity of the 0.8500 psychological mark, or its lowest level since August 2022 touched earlier this month, has run its course.
Traders might also refrain from placing aggressive bets and wait on the sidelines ahead of the crucial ECB policy meeting on Thursday. In the meantime, the release of the flash version of the UK PMI prints for July might influence the British Pound and provide some impetus to the EUR/GBP cross. Nevertheless, spot prices have now retreated nearly 100 pips from a nearly one-month high touched last week and a convincing break below the 0.8600 round figure should pave the way for a further intraday depreciating move.
Technical Levels: Supports and Resistances
EURGBP currently trading at 0.8624 at the time of writing. Pair opened at 0.8657 and is trading with a change of -0.38 % .
| Overview | Overview.1 | |
|---|---|---|
| 0 | Today last price | 0.8624 |
| 1 | Today Daily Change | -0.0033 |
| 2 | Today Daily Change % | -0.3800 |
| 3 | Today daily open | 0.8657 |
The pair is trading above its 20 Daily moving average @ 0.8587, above its 50 Daily moving average @ 0.8606 , below its 100 Daily moving average @ 0.8703 and below its 200 Daily moving average @ 0.873
| Trends | Trends.1 | |
|---|---|---|
| 0 | Daily SMA20 | 0.8587 |
| 1 | Daily SMA50 | 0.8606 |
| 2 | Daily SMA100 | 0.8703 |
| 3 | Daily SMA200 | 0.8730 |
The previous day high was 0.868 while the previous day low was 0.8634. The daily 38.2% Fib levels comes at 0.8662, expected to provide resistance. Similarly, the daily 61.8% fib level is at 0.8652, expected to provide resistance.
Note the levels of interest below:
- Pivot support is noted at 0.8634, 0.8611, 0.8588
- Pivot resistance is noted at 0.868, 0.8702, 0.8725
| Levels | Levels.1 |
|---|---|
| Previous Daily High | 0.8680 |
| Previous Daily Low | 0.8634 |
| Previous Weekly High | 0.8701 |
| Previous Weekly Low | 0.8570 |
| Previous Monthly High | 0.8658 |
| Previous Monthly Low | 0.8518 |
| Daily Fibonacci 38.2% | 0.8662 |
| Daily Fibonacci 61.8% | 0.8652 |
| Daily Pivot Point S1 | 0.8634 |
| Daily Pivot Point S2 | 0.8611 |
| Daily Pivot Point S3 | 0.8588 |
| Daily Pivot Point R1 | 0.8680 |
| Daily Pivot Point R2 | 0.8702 |
| Daily Pivot Point R3 | 0.8725 |
[/s2If]
Download Nehcap EAWe have two EAs that are operational on our LIVE accounts.
- EA-FIX: Check out the details here. Download EA-FIX . EA-FIX is a non-grid HFT scalper.
- EA-GROWTH: High quality low dd EA using trend grids. Download EA_GROWTHJoin Our Telegram Group
")


