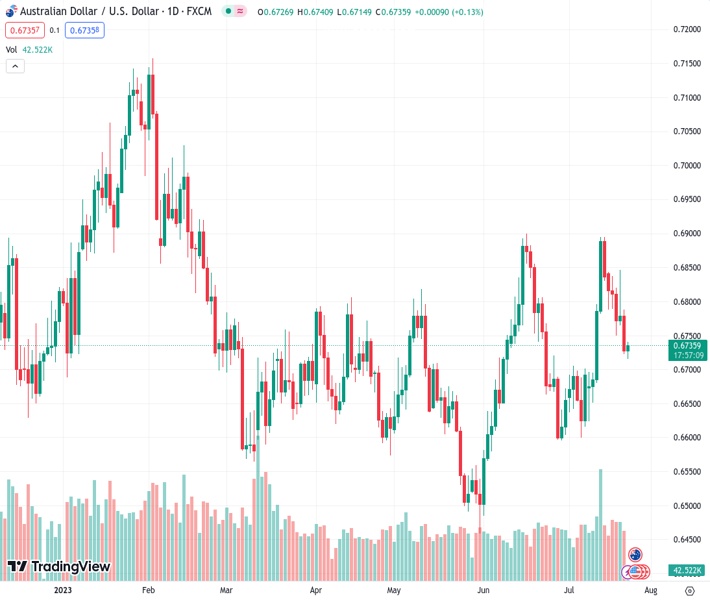
The AUDUSD pair, currently at 0.67342, rebounded from a descending support line that is a week old, following its first weekly decline in three weeks. The expectation from @nehcap is that there will only be a small recovery.
…
This is a premium post.
[s2If !current_user_can(access_s2member_level4)]Please register for FREE REGISTER to read full post below containing analysis. In case of any error or you think you are not able to read the full post below, please email us at support#nehcap.com [lwa][/s2If] [s2If current_user_can(access_s2member_level1)]
- AUD/USD bounces off one-week-old descending support line after posting the first weekly loss in three.
The pair currently trades last at 0.67342.
The previous day high was 0.6788 while the previous day low was 0.6722. The daily 38.2% Fib levels comes at 0.6747, expected to provide resistance. Similarly, the daily 61.8% fib level is at 0.6763, expected to provide resistance.
AUD/USD reverses from intraday low towards 0.6750 amid early Monday morning in Europe. In doing so, the Aussie pair recovers from the lowest levels in a week while bouncing off a one-week-old rising support line.
Apart from the short-term falling support line, the nearly oversold RSI (14) line also underpins bullish bias about the AUD/USD pair. However, the quote’s recovery needs validation from the previous support line from July 06, near 0.6750 by the press time. Adding strength to the 0.6750 hurdle is the 50% Fibonacci retracement of July 06-13 upside.
In a case where the AUD/USD price remains bullish past 0.6750, the 200-Hour Moving Average (HMA) surrounding 0.6800 and a downward-sloping resistance line from July 14, close to 0.6830 at the latest, will challenge the Aussie pair buyers before directing them to the previous monthly high of around 0.6900.
On the flip side, a downside break of the aforementioned immediate support line, close to 0.6715 by the press time, will need to break the 61.8% Fibonacci retracement level of around 0.6710, also known as the golden ratio, as well as the 0.6700 round figure to please AUD/USD bears.
Following that, a downward trajectory towards the late June swing low of around 0.6600 can’t be ruled out.
Overall, AUD/USD portrays a corrective bounce but remains on the bear’s radar at the start of the key week.
Trend: Limited recovery expected
Technical Levels: Supports and Resistances
AUDUSD currently trading at 0.6738 at the time of writing. Pair opened at 0.6731 and is trading with a change of 0.10% % .
| Overview | Overview.1 | |
|---|---|---|
| 0 | Today last price | 0.6738 |
| 1 | Today Daily Change | 0.0007 |
| 2 | Today Daily Change % | 0.10% |
| 3 | Today daily open | 0.6731 |
The pair remains strongly bullish on the daily timeframe. It trades above its 20 SMA @ 0.6718, 50 SMA 0.6691, 100 SMA @ 0.6687 and 200 SMA @ 0.6718.
| Trends | Trends.1 | |
|---|---|---|
| 0 | Daily SMA20 | 0.6718 |
| 1 | Daily SMA50 | 0.6691 |
| 2 | Daily SMA100 | 0.6687 |
| 3 | Daily SMA200 | 0.6718 |
The previous day high was 0.6788 while the previous day low was 0.6722. The daily 38.2% Fib levels comes at 0.6747, expected to provide resistance. Similarly, the daily 61.8% fib level is at 0.6763, expected to provide resistance.
Note the levels of interest below:
- Pivot support is noted at 0.6706, 0.6682, 0.6641
- Pivot resistance is noted at 0.6772, 0.6813, 0.6838
| Levels | Levels.1 |
|---|---|
| Previous Daily High | 0.6788 |
| Previous Daily Low | 0.6722 |
| Previous Weekly High | 0.6854 |
| Previous Weekly Low | 0.6722 |
| Previous Monthly High | 0.6900 |
| Previous Monthly Low | 0.6484 |
| Daily Fibonacci 38.2% | 0.6747 |
| Daily Fibonacci 61.8% | 0.6763 |
| Daily Pivot Point S1 | 0.6706 |
| Daily Pivot Point S2 | 0.6682 |
| Daily Pivot Point S3 | 0.6641 |
| Daily Pivot Point R1 | 0.6772 |
| Daily Pivot Point R2 | 0.6813 |
| Daily Pivot Point R3 | 0.6838 |
[/s2If]
Download Nehcap EAWe have two EAs that are operational on our LIVE accounts.
- EA-FIX: Check out the details here. Download EA-FIX . EA-FIX is a non-grid HFT scalper.
- EA-GROWTH: High quality low dd EA using trend grids. Download EA_GROWTHJoin Our Telegram Group
")


