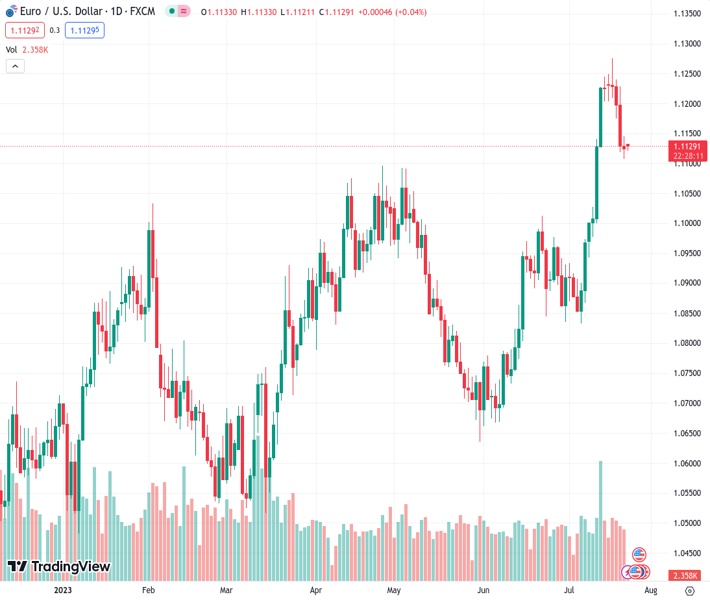
The EURUSD currency pair remains at a lower level after pulling back from its highest point in 17 months during the previous week.
…
This is a premium post.
[s2If !current_user_can(access_s2member_level4)]Please register for FREE REGISTER to read full post below containing analysis. In case of any error or you think you are not able to read the full post below, please email us at support#nehcap.com [lwa][/s2If] [s2If current_user_can(access_s2member_level1)]
- EUR/USD holds lower grounds after retreating from 17-month high in the last week.
The pair currently trades last at 1.11275.
The previous day high was 1.1145 while the previous day low was 1.1108. The daily 38.2% Fib levels comes at 1.1122, expected to provide support. Similarly, the daily 61.8% fib level is at 1.1131, expected to provide resistance.
EUR/USD licks its wounds at the lowest levels in more than a week, after declining in the last three consecutive days, as Euro traders brace for a bumper week comprising a slew of top-tier data/events. That said, the quote reversed from the highest levels since February 2022 in the last as the US Dollar cheered upbeat Retail Sales prints, as well as a recovery in the yields. However, the previous data anxiety prods the Euro pair traders of late around 1.1130.
US Dollar Index (DXY) not only posted the first weekly gains in three but also recovered notably from the lowest levels since April 2022, before ending the week around the highest levels in eight days. That said, the greenback’s gauge versus six major currencies seesaw around 101.00 amid a sluggish start to the key week.
That said, United States housing numbers and regional manufacturing indices were mostly downbeat but an improvement in the Retail Sales Control Group for June allowed the US Dollar Index (DXY) to rebound from a 15-month low, as well as post the first weekly gain in three.
Before that, the upbeat prints of the University of Michigan’s (UoM) Consumer Sentiment Index and consumer inflation expectations for July helped the greenback to challenge the bearish bias.
It’s worth noting, however, that the US Consumer Price Index (CPI) and Producer Price Index (PPI) for June joined the first below-expectations Nonfarm Payrolls (NFP) in 15 months to tease the Federal Reserve’s (Fed) policy pivot past July and drowned the US Dollar. Hence, the latest recovery in the US Dollar appears to lack support from the top-tier US inflation and employment data, which in turn prods the EUR/USD sellers as the key week begins.
On the other hand, European Central Bank (ECB) officials’ mixed statements fail to defend the ECB hawks and put a floor under the EUR/USD price amid the comparatively upbeat US data and Fed’s hawkish statements.
Amid these plays, Wall Street closed mixed while the US Treasury bond yields posted a mild weekly gain, which in turn favors US Dollar’s further upside and weighs on the EUR/USD price.
Looking forward, preliminary readings of the Eurozone and the US PMIs for July will direct immediate EUR/USD moves ahead of the monetary policy decision of the European central bank (ECB) and the Federal Reserve (Fed). Also important are the Eurozone and the US inflation clues, as well as the first readings of the second-quarter (Q2) 2023 Gross Domestic Product (GDP).
To sum up, EUR/USD will witness a heavily volatile week as top-tier data/events are up for fueling market volatility. That said, major attention will be given to the speeches of the ECB and Fed leaders.
A daily closing below the 17-month-old previous support line, around 1.1140 by the press time, directs EUR/USD bears toward April’s peak of 1.1095.
Technical Levels: Supports and Resistances
EURUSD currently trading at 1.1127 at the time of writing. Pair opened at 1.1127 and is trading with a change of 0.00% % .
| Overview | Overview.1 | |
|---|---|---|
| 0 | Today last price | 1.1127 |
| 1 | Today Daily Change | 0.0000 |
| 2 | Today Daily Change % | 0.00% |
| 3 | Today daily open | 1.1127 |
The pair remains strongly bullish on the daily timeframe. It trades above its 20 SMA @ 1.1029, 50 SMA 1.0894, 100 SMA @ 1.0882 and 200 SMA @ 1.0689.
| Trends | Trends.1 | |
|---|---|---|
| 0 | Daily SMA20 | 1.1029 |
| 1 | Daily SMA50 | 1.0894 |
| 2 | Daily SMA100 | 1.0882 |
| 3 | Daily SMA200 | 1.0689 |
The previous day high was 1.1145 while the previous day low was 1.1108. The daily 38.2% Fib levels comes at 1.1122, expected to provide support. Similarly, the daily 61.8% fib level is at 1.1131, expected to provide resistance.
Note the levels of interest below:
- Pivot support is noted at 1.1108, 1.1089, 1.1071
- Pivot resistance is noted at 1.1145, 1.1164, 1.1182
| Levels | Levels.1 |
|---|---|
| Previous Daily High | 1.1145 |
| Previous Daily Low | 1.1108 |
| Previous Weekly High | 1.1276 |
| Previous Weekly Low | 1.1108 |
| Previous Monthly High | 1.1012 |
| Previous Monthly Low | 1.0662 |
| Daily Fibonacci 38.2% | 1.1122 |
| Daily Fibonacci 61.8% | 1.1131 |
| Daily Pivot Point S1 | 1.1108 |
| Daily Pivot Point S2 | 1.1089 |
| Daily Pivot Point S3 | 1.1071 |
| Daily Pivot Point R1 | 1.1145 |
| Daily Pivot Point R2 | 1.1164 |
| Daily Pivot Point R3 | 1.1182 |
[/s2If]
Download Nehcap EAWe have two EAs that are operational on our LIVE accounts.
- EA-FIX: Check out the details here. Download EA-FIX . EA-FIX is a non-grid HFT scalper.
- EA-GROWTH: High quality low dd EA using trend grids. Download EA_GROWTHJoin Our Telegram Group
")


