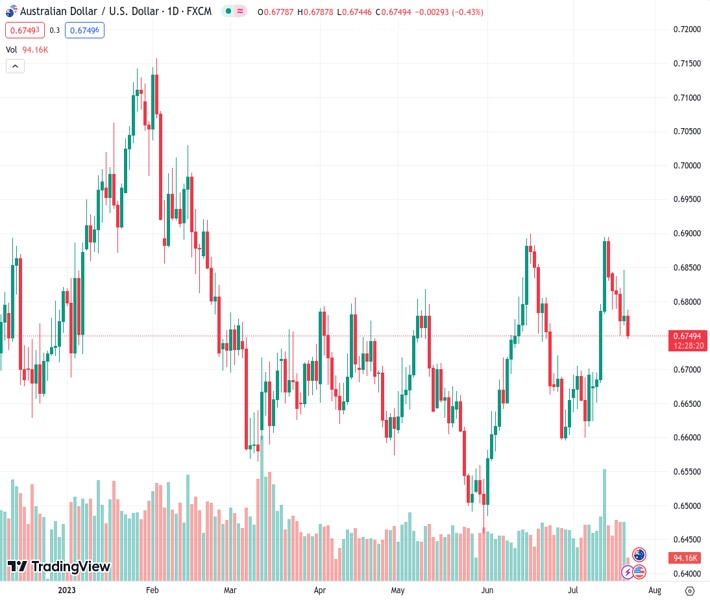
The AUDUSD currency pair, which was trading at 0.67483, encountered a new level of selling pressure on Friday and consequently moved closer to its lowest point of the week.
…
This is a premium post.
[s2If !current_user_can(access_s2member_level4)]Please register for FREE REGISTER to read full post below containing analysis. In case of any error or you think you are not able to read the full post below, please email us at support#nehcap.com [lwa][/s2If] [s2If current_user_can(access_s2member_level1)]
- AUD/USD meets with a fresh supply on Friday and drops back closer to the weekly low.
The pair currently trades last at 0.67483.
The previous day high was 0.6847 while the previous day low was 0.6766. The daily 38.2% Fib levels comes at 0.6816, expected to provide resistance. Similarly, the daily 61.8% fib level is at 0.6797, expected to provide resistance.
The AUD/USD pair extends the previous day’s sharp pullback from the vicinity of mid-0.6800s, or the weekly high and drifts lower through the early part of the European session on Friday. Spot prices currently trade around the 0.6750 region, which represents the weekly trough touched on Wednesday and the 50% Fibonacci retracement level of the recent rally from sub-0.6600 levels touched in late June.
Concerns over slowing economic growth in China, the worsening US-China trade ties and geopolitical risks overshadow the upbeat Australian jobs data released on Thursday, which puts pressure on the Reserve Bank of Australia (RBA) to hike further. This, along with a goodish pickup in the US Dollar (USD) demand, bolstered by a sharp fall in the Japanese Yen, exerts some downward pressure on the AUD/USD pair.
From a technical perspective, the recent failure near the 0.6900 round figure constitutes the formation of a bearish double-top pattern on the daily chart. That said, oscillators on the daily chart – though have been losing positive traction – are yet to confirm a negative outlook. This makes it prudent to wait for some follow-through selling below the 0.6750 support before positioning for any further intraday depreciating move.
The AUD/USD pair might then accelerate the fall towards challenging a technically significant 200-day Simple Moving Average (SMA), currently pegged just above the 0.6700 mark. The said handle coincides with the 61.8% Fibo. level, which if broken decisively will be seen as a fresh trigger for bearish traders and drag spot prices to the 0.6655-0.6650 intermediate support en route to sub-0.6600 levels, or the monthly low.
On the flip side, the 38.2% Fibo. level, around the 0.6775-0.6780 region, now seems to act as an immediate hurdle ahead of the 0.6800 mark. and the 0.6825 zone, or the 23.6% Fibo. A sustained strength beyond should allow the AUD/USD pair to make a fresh attempt to conquer the 0.6900 double-top barrier. Some follow-through buying will negate the bearish pattern and shift the near-term bias back in favour of bullish traders.
The subsequent short-covering rally has the potential to lift the AUD/USD pair to the 0.6970-0.6975 next relevant hurdle. This is closely followed by the 0.7000 psychological mark, above which the upward trajectory could get extended further towards the 0.7050-0.7055 area en route to the 0.7100 round figure. Spot prices could eventually climb to the YTD peak, around the 0.7155-0.7160 region touched in February.
Technical Levels: Supports and Resistances
AUDUSD currently trading at 0.6751 at the time of writing. Pair opened at 0.6779 and is trading with a change of -0.41 % .
| Overview | Overview.1 | |
|---|---|---|
| 0 | Today last price | 0.6751 |
| 1 | Today Daily Change | -0.0028 |
| 2 | Today Daily Change % | -0.4100 |
| 3 | Today daily open | 0.6779 |
The pair remains strongly bullish on the daily timeframe. It trades above its 20 SMA @ 0.6716, 50 SMA 0.6689, 100 SMA @ 0.6687 and 200 SMA @ 0.6715.
| Trends | Trends.1 | |
|---|---|---|
| 0 | Daily SMA20 | 0.6716 |
| 1 | Daily SMA50 | 0.6689 |
| 2 | Daily SMA100 | 0.6687 |
| 3 | Daily SMA200 | 0.6715 |
The previous day high was 0.6847 while the previous day low was 0.6766. The daily 38.2% Fib levels comes at 0.6816, expected to provide resistance. Similarly, the daily 61.8% fib level is at 0.6797, expected to provide resistance.
Note the levels of interest below:
- Pivot support is noted at 0.6747, 0.6716, 0.6666
- Pivot resistance is noted at 0.6829, 0.6878, 0.691
| Levels | Levels.1 |
|---|---|
| Previous Daily High | 0.6847 |
| Previous Daily Low | 0.6766 |
| Previous Weekly High | 0.6895 |
| Previous Weekly Low | 0.6624 |
| Previous Monthly High | 0.6900 |
| Previous Monthly Low | 0.6484 |
| Daily Fibonacci 38.2% | 0.6816 |
| Daily Fibonacci 61.8% | 0.6797 |
| Daily Pivot Point S1 | 0.6747 |
| Daily Pivot Point S2 | 0.6716 |
| Daily Pivot Point S3 | 0.6666 |
| Daily Pivot Point R1 | 0.6829 |
| Daily Pivot Point R2 | 0.6878 |
| Daily Pivot Point R3 | 0.6910 |
[/s2If]
Download Nehcap EAWe have two EAs that are operational on our LIVE accounts.
- EA-FIX: Check out the details here. Download EA-FIX . EA-FIX is a non-grid HFT scalper.
- EA-GROWTH: High quality low dd EA using trend grids. Download EA_GROWTHJoin Our Telegram Group
")


