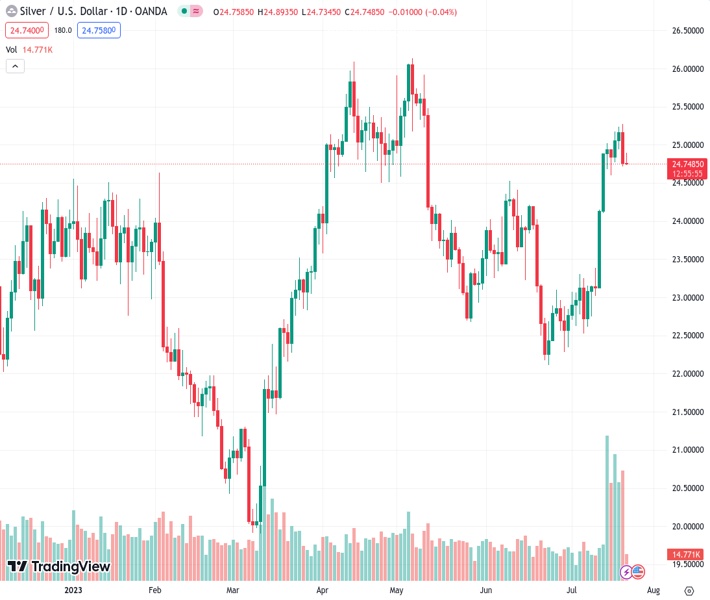
Silver prices gain upward momentum on Friday, trading at $24.749, as it recovers from a decline experienced the day before.
…
This is a premium post.
[s2If !current_user_can(access_s2member_level4)]Please register for FREE REGISTER to read full post below containing analysis. In case of any error or you think you are not able to read the full post below, please email us at support#nehcap.com [lwa][/s2If] [s2If current_user_can(access_s2member_level1)]
- Silver regains positive traction on Friday and reverses a part of the previous day’s downfall.
The pair currently trades last at 24.749.
The previous day high was 25.27 while the previous day low was 24.71. The daily 38.2% Fib levels comes at 24.92, expected to provide resistance. Similarly, the daily 61.8% fib level is at 25.06, expected to provide resistance.
Silver catches fresh bids on Friday and reverses a part of the previous day’s sharp retracement slide from the $25.25 area, or its highest level since May 11. The white metal sticks to its intraday gains through the early European session and currently trades near the daily peak, just below the $25.00 psychological mark.
From a technical perspective, the XAG/USD manages to defend the $24.60-$24.50 strong horizontal resistance breakpoint, now turned support. The said area should now act as a pivotal point, which if broken decisively might prompt some technical selling. Silver might then accelerate the slide towards the $24.00 mark en route to the $23.65-$23.60 support zone and the $23.20-$23.15 region.
The next relevant support is pegged near the $23.00 round figure, which if broken decisively will negate any near-term positive outlook and shift the bias in favour of bearish traders. Some follow-through selling below the $22.75-$22.70 area would reaffirm the negative outlook and make the XAG/USD vulnerable to sliding back towards challenging the multi-month low, around the $22.15-$22.10 area.
Meanwhile, technical indicators on the daily chart are holding comfortably in the positive territory and are still far from being in the overbought zone. This, in turn, favours bullish traders and suggests that the path of least resistance for the XAG/USD is to the upside. That said, it will be prudent to wait for a move beyond the overnight swing high, around the $25.25 area, before placing fresh bets.
The XAG/USD might then aim to surpass the $25.50-$25.55 intermediate hurdle and reclaim the $26.00 round figure. This is closely followed by the YTD peak, around the $26.10-$26.15 area touched in May, which if cleared will set the stage for an extension of the recent upward trajectory witnessed over the past month or so.
Technical Levels: Supports and Resistances
XAGUSD currently trading at 24.86 at the time of writing. Pair opened at 24.76 and is trading with a change of 0.4 % .
| Overview | Overview.1 | |
|---|---|---|
| 0 | Today last price | 24.86 |
| 1 | Today Daily Change | 0.10 |
| 2 | Today Daily Change % | 0.40 |
| 3 | Today daily open | 24.76 |
The pair remains strongly bullish on the daily timeframe. It trades above its 20 SMA @ 23.55, 50 SMA 23.57, 100 SMA @ 23.69 and 200 SMA @ 22.88.
| Trends | Trends.1 | |
|---|---|---|
| 0 | Daily SMA20 | 23.55 |
| 1 | Daily SMA50 | 23.57 |
| 2 | Daily SMA100 | 23.69 |
| 3 | Daily SMA200 | 22.88 |
The previous day high was 25.27 while the previous day low was 24.71. The daily 38.2% Fib levels comes at 24.92, expected to provide resistance. Similarly, the daily 61.8% fib level is at 25.06, expected to provide resistance.
Note the levels of interest below:
- Pivot support is noted at 24.56, 24.36, 24.0
- Pivot resistance is noted at 25.11, 25.47, 25.67
| Levels | Levels.1 |
|---|---|
| Previous Daily High | 25.27 |
| Previous Daily Low | 24.71 |
| Previous Weekly High | 25.02 |
| Previous Weekly Low | 22.75 |
| Previous Monthly High | 24.53 |
| Previous Monthly Low | 22.11 |
| Daily Fibonacci 38.2% | 24.92 |
| Daily Fibonacci 61.8% | 25.06 |
| Daily Pivot Point S1 | 24.56 |
| Daily Pivot Point S2 | 24.36 |
| Daily Pivot Point S3 | 24.00 |
| Daily Pivot Point R1 | 25.11 |
| Daily Pivot Point R2 | 25.47 |
| Daily Pivot Point R3 | 25.67 |
[/s2If]
Download Nehcap EAWe have two EAs that are operational on our LIVE accounts.
- EA-FIX: Check out the details here. Download EA-FIX . EA-FIX is a non-grid HFT scalper.
- EA-GROWTH: High quality low dd EA using trend grids. Download EA_GROWTHJoin Our Telegram Group
")


