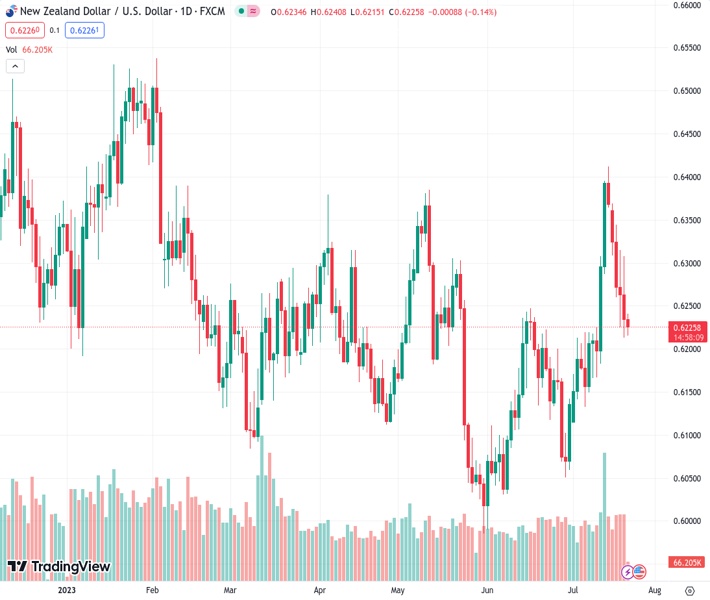
The NZD/USD pair continues to decline for the sixth day in a row, currently trading at 0.62238.
…
This is a premium post.
[s2If !current_user_can(access_s2member_level4)]Please register for FREE REGISTER to read full post below containing analysis. In case of any error or you think you are not able to read the full post below, please email us at support#nehcap.com [lwa][/s2If] [s2If current_user_can(access_s2member_level1)]
- NZD/USD extends its downside for the sixth consecutive day.
The pair currently trades last at 0.62238.
The previous day high was 0.6309 while the previous day low was 0.6213. The daily 38.2% Fib levels comes at 0.625, expected to provide resistance. Similarly, the daily 61.8% fib level is at 0.6272, expected to provide resistance.
The NZD/USD pair currently trades around 0.6220 heading into the European session on Friday. The pair is under selling pressure for the sixth consecutive day amid the strength of the US Dollar. The possibility of a resumed hawkish stance from the Federal Reserve (Fed) following the Unemployment Claims report on Thursday boosts the US Dollar across the board and acts as a headwind for NZD/USD.
Looking at the one-hour chart, the key support zone is located at 0.6200, indicating a confluence of a psychological round mark and lower limit of a downward-sloping trend channel. Any meaningful follow-through selling below the latter will see a drop accelerate to 0.6180 (Low of July 12). In case the selling pressure remains, the pair would see the next level of contention at 0.6165 (Low of July 11) en route to 0.6130 (Low of July 6).
It’s worth noting that the 100-hour Exponential Moving Average (EMA) is on the verge of crossing below the 200-hour EMA. If a decisive crossover occurs on the one-hour chart, It would validate a Bear Cross, highlighting the path of least resistance for the cross is to the downside.
On the upside, the immediate resistance level is seen at 0.6285, portraying the upper boundary of a downward-sloping trend channel. A decisive break above the mentioned level would drive the pair towards 0.6300 (a psychological round mark, High of July 20), followed by 0.6345 (High of July 18). The additional upside filter appears at 0.6400.
However, further downside appears favorable as the Relative Strength Index (RSI) stands below 50, activating the bearish momentum for the NZD/USD pair.
Technical Levels: Supports and Resistances
NZDUSD currently trading at 0.622 at the time of writing. Pair opened at 0.6235 and is trading with a change of -0.24 % .
| Overview | Overview.1 | |
|---|---|---|
| 0 | Today last price | 0.6220 |
| 1 | Today Daily Change | -0.0015 |
| 2 | Today Daily Change % | -0.2400 |
| 3 | Today daily open | 0.6235 |
The pair remains strongly bullish on the daily timeframe. It trades above its 20 SMA @ 0.6207, 50 SMA 0.6171, 100 SMA @ 0.6195 and 200 SMA @ 0.6203.
| Trends | Trends.1 | |
|---|---|---|
| 0 | Daily SMA20 | 0.6207 |
| 1 | Daily SMA50 | 0.6171 |
| 2 | Daily SMA100 | 0.6195 |
| 3 | Daily SMA200 | 0.6203 |
The previous day high was 0.6309 while the previous day low was 0.6213. The daily 38.2% Fib levels comes at 0.625, expected to provide resistance. Similarly, the daily 61.8% fib level is at 0.6272, expected to provide resistance.
Note the levels of interest below:
- Pivot support is noted at 0.6196, 0.6156, 0.61
- Pivot resistance is noted at 0.6292, 0.6348, 0.6388
| Levels | Levels.1 |
|---|---|
| Previous Daily High | 0.6309 |
| Previous Daily Low | 0.6213 |
| Previous Weekly High | 0.6413 |
| Previous Weekly Low | 0.6166 |
| Previous Monthly High | 0.6250 |
| Previous Monthly Low | 0.5990 |
| Daily Fibonacci 38.2% | 0.6250 |
| Daily Fibonacci 61.8% | 0.6272 |
| Daily Pivot Point S1 | 0.6196 |
| Daily Pivot Point S2 | 0.6156 |
| Daily Pivot Point S3 | 0.6100 |
| Daily Pivot Point R1 | 0.6292 |
| Daily Pivot Point R2 | 0.6348 |
| Daily Pivot Point R3 | 0.6388 |
[/s2If]
Download Nehcap EAWe have two EAs that are operational on our LIVE accounts.
- EA-FIX: Check out the details here. Download EA-FIX . EA-FIX is a non-grid HFT scalper.
- EA-GROWTH: High quality low dd EA using trend grids. Download EA_GROWTHJoin Our Telegram Group


