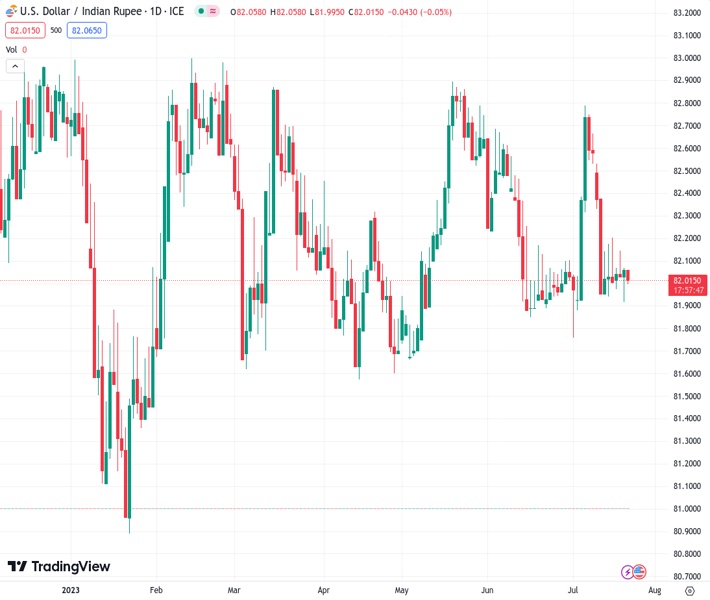
On Friday, the USD/INR currency pair encountered resistance near the 200-day simple moving average (SMA) level at 82.0310.
…
This is a premium post.
[s2If !current_user_can(access_s2member_level4)]Please register for FREE REGISTER to read full post below containing analysis. In case of any error or you think you are not able to read the full post below, please email us at support#nehcap.com [lwa][/s2If] [s2If current_user_can(access_s2member_level1)]
- USD/INR meets with a fresh supply near the 200-day SMA barrier on Friday.
The pair currently trades last at 82.0310.
The previous day high was 82.1602 while the previous day low was 81.9116. The daily 38.2% Fib levels comes at 82.0652, expected to provide resistance. Similarly, the daily 61.8% fib level is at 82.0065, expected to provide support.
The USD/INR pair struggles to capitalize on the overnight bounce from the 81.90 area, or over a two-week low and attracts fresh selling near a technically significant 200-day Simple Moving Average (SMA) on Friday. Spot prices slide back closer to the 82.00 mark during the Asian session and currently trade near the lower end of a familiar range held over the past week or so.
From a technical perspective, the recent repeated failures near the very important 200-day SMA favour bearish traders and support prospects for some meaningful downside. Moreover, oscillators on the daily chart have again started gaining negative traction and
suggest that the path of least resistance for the USD/INR pair is to the downside. That said, it will still be prudent to wait for a sustained breakdown through the lower end of a symmetrical triangle, extending from October 2022, before positioning for any further losses.
Some follow-through selling below the monthly low, around the 81.75 region, will reaffirm the bearish outlook and drag the USD/INR pair towards the next relevant support near the 81.50 zone. Spot prices could eventually drop to test sub-81.00 levels or the YTD low touched in January.
On the flip side, the 82.15-82.20 area, or the 200-day SMA, might continue to act as an immediate strong barrier. A sustained move beyond has the potential to lift the USD/INR pair back to the triangle resistance, currently around the 82.80 area, above which bulls could make a fresh attempt to conquer the 83.00 round figure. The said handle has been acting as a strong barrier since the beginning of this year.
Hence, a convincing breakthrough will be seen as a fresh trigger for bullish traders and set the stage for an extension of the USD/INR pair’s well-established uptrend witnessed since August 2022. Spot prices might then surpass the all-time peak, around the 83.40-83.45 region touched in October 2022, and aim to reclaim the 84.00 mark.
Technical Levels: Supports and Resistances
USDINR currently trading at 82.0554 at the time of writing. Pair opened at 82.16 and is trading with a change of -0.13 % .
| Overview | Overview.1 | |
|---|---|---|
| 0 | Today last price | 82.0554 |
| 1 | Today Daily Change | -0.1046 |
| 2 | Today Daily Change % | -0.1300 |
| 3 | Today daily open | 82.1600 |
The pair remains strongly bearish on the daily time frame. It trades below the 20 SMA @ 82.1763, 50 SMA 82.3142, 100 SMA @ 82.1902 and 200 SMA @ 82.1757.
| Trends | Trends.1 | |
|---|---|---|
| 0 | Daily SMA20 | 82.1763 |
| 1 | Daily SMA50 | 82.3142 |
| 2 | Daily SMA100 | 82.1902 |
| 3 | Daily SMA200 | 82.1757 |
The previous day high was 82.1602 while the previous day low was 81.9116. The daily 38.2% Fib levels comes at 82.0652, expected to provide resistance. Similarly, the daily 61.8% fib level is at 82.0065, expected to provide support.
Note the levels of interest below:
- Pivot support is noted at 81.9944, 81.8287, 81.7458
- Pivot resistance is noted at 82.2429, 82.3258, 82.4915
| Levels | Levels.1 |
|---|---|
| Previous Daily High | 82.1602 |
| Previous Daily Low | 81.9116 |
| Previous Weekly High | 82.7256 |
| Previous Weekly Low | 81.9215 |
| Previous Monthly High | 82.7370 |
| Previous Monthly Low | 81.8477 |
| Daily Fibonacci 38.2% | 82.0652 |
| Daily Fibonacci 61.8% | 82.0065 |
| Daily Pivot Point S1 | 81.9944 |
| Daily Pivot Point S2 | 81.8287 |
| Daily Pivot Point S3 | 81.7458 |
| Daily Pivot Point R1 | 82.2429 |
| Daily Pivot Point R2 | 82.3258 |
| Daily Pivot Point R3 | 82.4915 |
[/s2If]
Download Nehcap EAWe have two EAs that are operational on our LIVE accounts.
- EA-FIX: Check out the details here. Download EA-FIX . EA-FIX is a non-grid HFT scalper.
- EA-GROWTH: High quality low dd EA using trend grids. Download EA_GROWTHJoin Our Telegram Group
")


