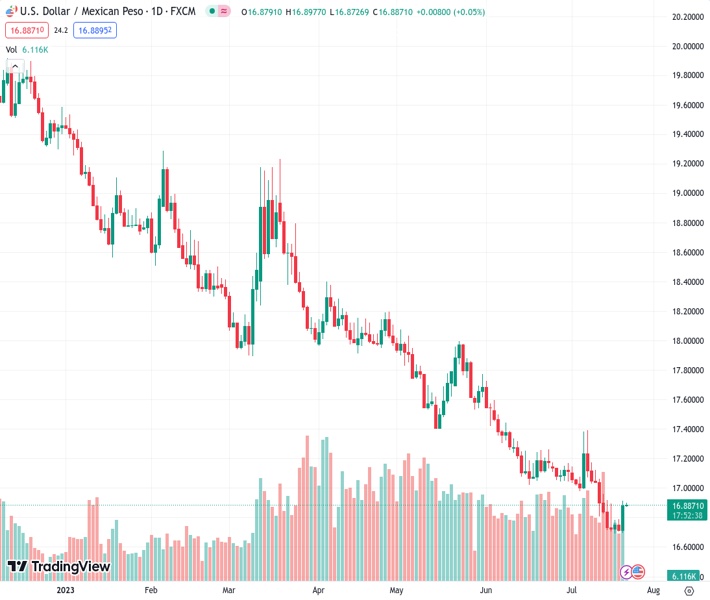
The USDMXN exchange rate, which reached a weekly high the day before, has slightly decreased recently. According to the perspective of @nehcap, there are not expected to be significant gains in the near future.
…
This is a premium post.
[s2If !current_user_can(access_s2member_level4)]Please register for FREE REGISTER to read full post below containing analysis. In case of any error or you think you are not able to read the full post below, please email us at support#nehcap.com [lwa][/s2If] [s2If current_user_can(access_s2member_level1)]
- USD/MXN retreats from weekly top marked the previous day, mildly offered of late.
The pair currently trades last at 16.8841.
The previous day high was 16.9154 while the previous day low was 16.7032. The daily 38.2% Fib levels comes at 16.8344, expected to provide support. Similarly, the daily 61.8% fib level is at 16.7843, expected to provide support.
USD/MXN bulls take a breather around 16.88 amid early Friday morning in Europe, after rising the most in two weeks. In doing so, the Mexican Peso (MXN) pair cheered the upside beak of a one-week-old descending trend line, as well as the bullish MACD signals.
However, a convergence of the previous support line from mid-June and the 100-bar Exponential Moving Average (EMA), around 16.95 at the latest, restricts the immediate recovery of the USD/MXN pair.
Above all, USD/MXN buyers remain off the table unless posting a successful upside break of the 10-week-old bearish channel’s top line, close to 17.22 at the latest.
Even so, the monthly high of 17.40 will act as the last defense of the USD/MXN bears.
On the flip side, the previous resistance line from July 13, close to 16.80, limits immediate USD/MXN downside during a fresh pullback.
Following that, a one-week-old horizontal support zone and bottom line of the stated channel, respectively near 16.70 and 16.65, will be crucial to watch for clear directions.
Should the Mexican Peso fail to recover from 16.65, the odds of witnessing a slump toward the October 2015 low of 16.32 can’t be ruled out.
Trend: Limited upside expected
Technical Levels: Supports and Resistances
USDMXN currently trading at 16.8827 at the time of writing. Pair opened at 16.89 and is trading with a change of -0.04% % .
| Overview | Overview.1 | |
|---|---|---|
| 0 | Today last price | 16.8827 |
| 1 | Today Daily Change | -0.0073 |
| 2 | Today Daily Change % | -0.04% |
| 3 | Today daily open | 16.89 |
The pair remains strongly bearish on the daily time frame. It trades below the 20 SMA @ 16.9958, 50 SMA 17.2808, 100 SMA @ 17.7278 and 200 SMA @ 18.4819.
| Trends | Trends.1 | |
|---|---|---|
| 0 | Daily SMA20 | 16.9958 |
| 1 | Daily SMA50 | 17.2808 |
| 2 | Daily SMA100 | 17.7278 |
| 3 | Daily SMA200 | 18.4819 |
The previous day high was 16.9154 while the previous day low was 16.7032. The daily 38.2% Fib levels comes at 16.8344, expected to provide support. Similarly, the daily 61.8% fib level is at 16.7843, expected to provide support.
Note the levels of interest below:
- Pivot support is noted at 16.7571, 16.6241, 16.5449
- Pivot resistance is noted at 16.9692, 17.0484, 17.1814
| Levels | Levels.1 |
|---|---|
| Previous Daily High | 16.9154 |
| Previous Daily Low | 16.7032 |
| Previous Weekly High | 17.1746 |
| Previous Weekly Low | 16.7167 |
| Previous Monthly High | 17.7286 |
| Previous Monthly Low | 17.0243 |
| Daily Fibonacci 38.2% | 16.8344 |
| Daily Fibonacci 61.8% | 16.7843 |
| Daily Pivot Point S1 | 16.7571 |
| Daily Pivot Point S2 | 16.6241 |
| Daily Pivot Point S3 | 16.5449 |
| Daily Pivot Point R1 | 16.9692 |
| Daily Pivot Point R2 | 17.0484 |
| Daily Pivot Point R3 | 17.1814 |
[/s2If]
Download Nehcap EAWe have two EAs that are operational on our LIVE accounts.
- EA-FIX: Check out the details here. Download EA-FIX . EA-FIX is a non-grid HFT scalper.
- EA-GROWTH: High quality low dd EA using trend grids. Download EA_GROWTHJoin Our Telegram Group
")


