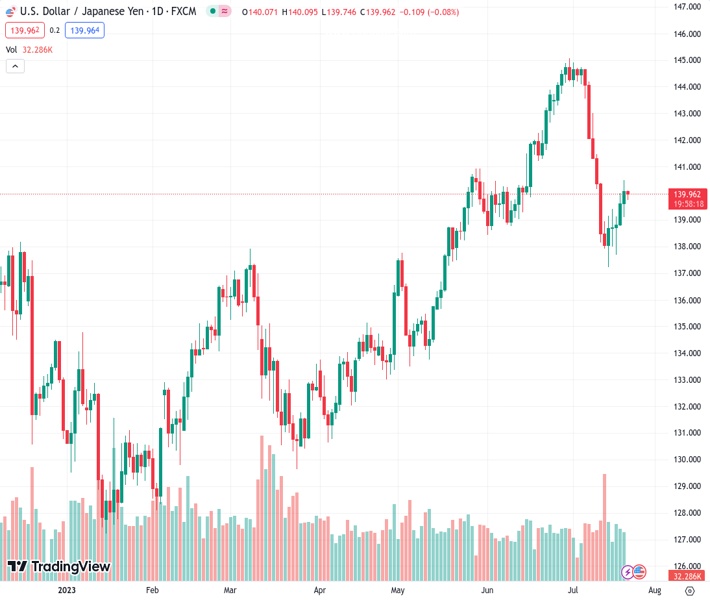
The USDJPY currency pair, trading at 139.970, encounters a new level of selling pressure, causing it to end a run of five consecutive days of gains and fall back from its highest level in over a week.
…
This is a premium post.
[s2If !current_user_can(access_s2member_level4)]Please register for FREE REGISTER to read full post below containing analysis. In case of any error or you think you are not able to read the full post below, please email us at support#nehcap.com [lwa][/s2If] [s2If current_user_can(access_s2member_level1)]
- USD/JPY meets with a fresh supply and snaps a five-day winning streak to over a one-week high.
The pair currently trades last at 139.970.
The previous day high was 140.5 while the previous day low was 139.11. The daily 38.2% Fib levels comes at 139.97, expected to provide resistance. Similarly, the daily 61.8% fib level is at 139.64, expected to provide support.
The USD/JPY pair edges lower during the Asian session on Friday and moves away from over a one-week high, around the 140.50 region touched the previous day. Spot prices, for now, seem to have snapped a five-days winning streak and currently trade around the 139.85 region, down 0.15% for the day.
A generally weaker tone around the equity markets, along with concerns over slowing growth in China, the worsening US-China relations and geopolitical risks, benefit the safe-haven Japanese Yen (JPY), which, in turn, exert pressure on the USD/JPY pair. The JPY draws additional support from an uptick in the country’s core inflation rate. In fact, Japan Statistics Bureau reported that the National core CPI, which strips out costs of fresh food, edged higher to 3.3% YoY rate in June. The headline CPI also came in at 3.3% and remained above the Bank of Japan’s 2% target for the 15th straight month.
The data reignited expectations of a BoJ policy shift. That said, the BoJ Governor Kazuo Ueda had signalled earlier this week to maintain ultra-loose monetary policy for the time being and noted that there is still some distance to sustainably achieve the 2% inflation target. Furthermore, the Japanese government lowered its economic growth forecast on Thursday, which might hold back traders from placing aggressive bullish bets around the JPY. Meanwhile, a subdued US Dollar (USD) price action does little to impress traders or provide any meaningful impetus to the USD/JPY pair.
In fact, the USD Index (DXY), which tracks the Greenback against a basket of currencies, is seen consolidating the previous day’s strong move up to over a one-week high touched in the aftemath of the upbeat US labour market data. In fact, the US Labor Department reported that Weekly Initial Jobless Claims dropped to a seasonally adjusted 228,000 for the week ended July 15 and reaffirmed bets for a 25 bps rate hike by the Federal Reserve (Fed) in July. Moreover, doubts that the Fed will commit to a more dovish policy stance should act as a tailwind for the USD and the USD/JPY pair.
In the absence of any relevant market moving economic data from the US, the aforementioned mixed fundamental backdrop might hold back traders from placing aggressive directional bets ahead of next week’s key central bank event risks. The Fed is scheduled to announce its decision at the end of a two-day monetary policy meeting on Wednesday. This will be followed by the BoJ meeting on Thursday and Friday, which, in turn, should help investors to determine the near-term trajectory for the USD/JPY pair.
Technical Levels: Supports and Resistances
USDJPY currently trading at 139.88 at the time of writing. Pair opened at 140.08 and is trading with a change of -0.14 % .
| Overview | Overview.1 | |
|---|---|---|
| 0 | Today last price | 139.88 |
| 1 | Today Daily Change | -0.20 |
| 2 | Today Daily Change % | -0.14 |
| 3 | Today daily open | 140.08 |
The pair is trading below its 20 Daily moving average @ 141.96, below its 50 Daily moving average @ 140.51 , above its 100 Daily moving average @ 137.14 and above its 200 Daily moving average @ 136.95
| Trends | Trends.1 | |
|---|---|---|
| 0 | Daily SMA20 | 141.96 |
| 1 | Daily SMA50 | 140.51 |
| 2 | Daily SMA100 | 137.14 |
| 3 | Daily SMA200 | 136.95 |
The previous day high was 140.5 while the previous day low was 139.11. The daily 38.2% Fib levels comes at 139.97, expected to provide resistance. Similarly, the daily 61.8% fib level is at 139.64, expected to provide support.
Note the levels of interest below:
- Pivot support is noted at 139.29, 138.51, 137.91
- Pivot resistance is noted at 140.68, 141.28, 142.07
| Levels | Levels.1 |
|---|---|
| Previous Daily High | 140.50 |
| Previous Daily Low | 139.11 |
| Previous Weekly High | 143.00 |
| Previous Weekly Low | 137.24 |
| Previous Monthly High | 145.07 |
| Previous Monthly Low | 138.43 |
| Daily Fibonacci 38.2% | 139.97 |
| Daily Fibonacci 61.8% | 139.64 |
| Daily Pivot Point S1 | 139.29 |
| Daily Pivot Point S2 | 138.51 |
| Daily Pivot Point S3 | 137.91 |
| Daily Pivot Point R1 | 140.68 |
| Daily Pivot Point R2 | 141.28 |
| Daily Pivot Point R3 | 142.07 |
[/s2If]
Download Nehcap EAWe have two EAs that are operational on our LIVE accounts.
- EA-FIX: Check out the details here. Download EA-FIX . EA-FIX is a non-grid HFT scalper.
- EA-GROWTH: High quality low dd EA using trend grids. Download EA_GROWTHJoin Our Telegram Group
")


