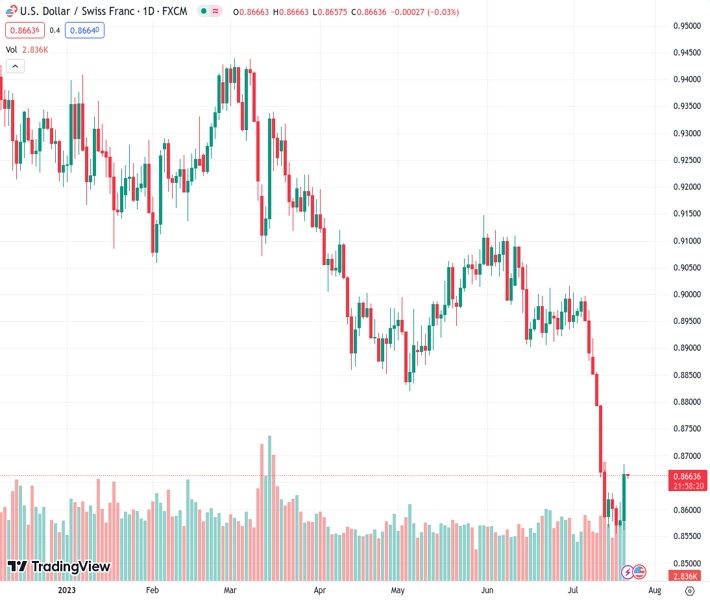
The USDCHF pair, which was trading at a low of around 0.8560 earlier in the year, experienced a gain of more than 1% on Thursday and is currently trading at 0.8664.
…
This is a premium post.
[s2If !current_user_can(access_s2member_level4)]Please register for FREE REGISTER to read full post below containing analysis. In case of any error or you think you are not able to read the full post below, please email us at support#nehcap.com [lwa][/s2If] [s2If current_user_can(access_s2member_level1)]
- USD/CHF gained over 1% on Thursday, recovering from yearly lows around 0.8560 to trade at 0.8664.
The pair currently trades last at 0.86670.
The previous day high was 0.8614 while the previous day low was 0.8567. The daily 38.2% Fib levels comes at 0.8596, expected to provide support. Similarly, the daily 61.8% fib level is at 0.8585, expected to provide support.
The USD/CHF bounced from yearly lows and gained more than 1% on Thursday, courtesy of a risk-off impulse and higher US Treasury bond yields, which bolstered the greenback. Hence, as the US Dollar Index (DXY) rose, the USD/CHF recovered from around 0.8560 and exchanged hands at 0.8664.
The daily chart portrays the pair’s ongoing upward correction after registering year-to-date (YTD) lows of 0.8554. As sellers could not drag prices beneath 0.8550, that exacerbated the USD/CHF Thursday’s rally, breaking technical levels on its way up. The uptrend was capped at the 23.6% Fibonacci (Fibo) retracement at 0.8667.
If USD/CHF buyers would like to shift the bias to neutral, they need to lift the major towards the 61.80% Fibo retracement at 0.8830, but on its way north, they would face key resistance areas. Those are the 38.20% Fibo level at 0.8729, followed by the 50% Fibo at 0.8780. Conversely, if USD/CHF exchange rates drop below 0.8600, that could pave the way for resuming the downtrend.
Technical Levels: Supports and Resistances
USDCHF currently trading at 0.8663 at the time of writing. Pair opened at 0.8585 and is trading with a change of 0.91 % .
| Overview | Overview.1 | |
|---|---|---|
| 0 | Today last price | 0.8663 |
| 1 | Today Daily Change | 0.0078 |
| 2 | Today Daily Change % | 0.9100 |
| 3 | Today daily open | 0.8585 |
The pair remains strongly bearish on the daily time frame. It trades below the 20 SMA @ 0.8839, 50 SMA 0.8946, 100 SMA @ 0.9016 and 200 SMA @ 0.9232.
| Trends | Trends.1 | |
|---|---|---|
| 0 | Daily SMA20 | 0.8839 |
| 1 | Daily SMA50 | 0.8946 |
| 2 | Daily SMA100 | 0.9016 |
| 3 | Daily SMA200 | 0.9232 |
The previous day high was 0.8614 while the previous day low was 0.8567. The daily 38.2% Fib levels comes at 0.8596, expected to provide support. Similarly, the daily 61.8% fib level is at 0.8585, expected to provide support.
Note the levels of interest below:
- Pivot support is noted at 0.8564, 0.8542, 0.8517
- Pivot resistance is noted at 0.861, 0.8635, 0.8657
| Levels | Levels.1 |
|---|---|
| Previous Daily High | 0.8614 |
| Previous Daily Low | 0.8567 |
| Previous Weekly High | 0.8918 |
| Previous Weekly Low | 0.8566 |
| Previous Monthly High | 0.9120 |
| Previous Monthly Low | 0.8902 |
| Daily Fibonacci 38.2% | 0.8596 |
| Daily Fibonacci 61.8% | 0.8585 |
| Daily Pivot Point S1 | 0.8564 |
| Daily Pivot Point S2 | 0.8542 |
| Daily Pivot Point S3 | 0.8517 |
| Daily Pivot Point R1 | 0.8610 |
| Daily Pivot Point R2 | 0.8635 |
| Daily Pivot Point R3 | 0.8657 |
[/s2If]
Download Nehcap EAWe have two EAs that are operational on our LIVE accounts.
- EA-FIX: Check out the details here. Download EA-FIX . EA-FIX is a non-grid HFT scalper.
- EA-GROWTH: High quality low dd EA using trend grids. Download EA_GROWTHJoin Our Telegram Group
")


