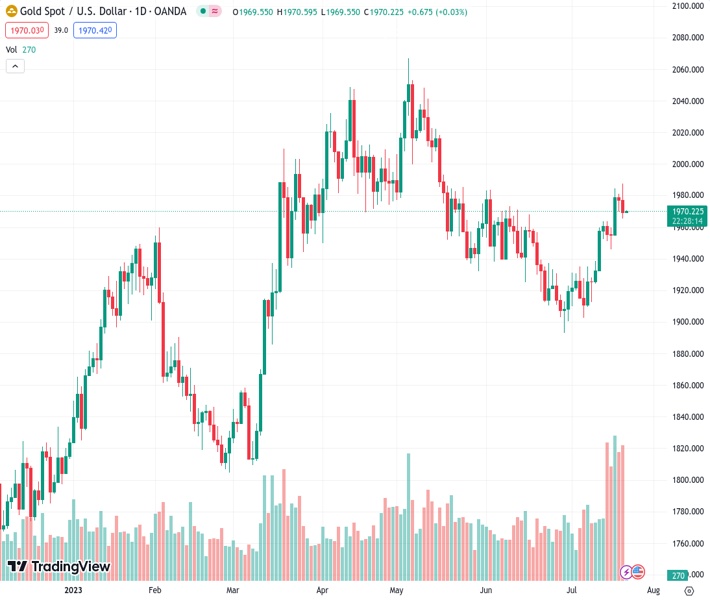
The price of gold, represented by #XAUUSD at 1,970.22, has pulled back from its recent peak but remains in a positive trend for the past three weeks, according to @nehcap, indicating a bullish sentiment.
…
This is a premium post.
[s2If !current_user_can(access_s2member_level4)]Please register for FREE REGISTER to read full post below containing analysis. In case of any error or you think you are not able to read the full post below, please email us at support#nehcap.com [lwa][/s2If] [s2If current_user_can(access_s2member_level1)]
- Gold Price retreats from two-month high but stays well set for three-week uptrend.
The pair currently trades last at 1970.22.
The previous day high was 1981.01 while the previous day low was 1969.83. The daily 38.2% Fib levels comes at 1974.1, expected to provide resistance. Similarly, the daily 61.8% fib level is at 1976.74, expected to provide resistance.
Gold Price (XAU/USD) remains pressured at $1,9170 amid early Friday morning in Asia, after reversing from a nine-week high as market players seek more clues to justify the latest pullback in the metal’s prices. Despite the retreat, the XAU/USD remains on the way to posting the third consecutive weekly gain while ignoring the US Dollar’s ability to recover from a 15-month low. It should be noted that the recently welcome United States Initial Jobless Claims and the US Treasury bond yields joined downbeat Wall Street to trigger the Gold Price pullback from the multi-day high. However, mixed concerns about the US Federal Reserve (Fed) and China, one of the world’s biggest customers, seem to prod the XAU/USD bears ahead of the key week comprising top-tier central bank announcements.
Gold Price reversed from the highest level since May 17 the previous day after the US Dollar Index (DXY) rose the most in two months on a day while refreshing the weekly top. In doing so, the greenback’s gauge versus the six major currencies took clues from the upbeat employment clues from home, as well as a recovery in US Treasury bond yields.
That said, US Initial Jobless Claims dropped to 228K for the week ended on July 14, the lowest since May, versus 237K prior and 242K market forecasts but the Continuing Jobless Claims rose to 1.754M for the said period compared to market forecasts of reprinting 1.729M figures. Additionally, the Philadelphia Fed Manufacturing Survey gauge improved to -13.5 for July from -13.7 prior, versus -10 expected while Existing Home Sales slumped -3.3% MoM in June compared to 0.2% prior gain.
Previously, US Building Permits and Housing Stars also reported downbeat figures for June whereas the Retail Sales growth eased despite posting upbeat details of Retail Sales Control Group for June.
Despite the recently upbeat US employment clues, the US statistics haven’t been impressive to support the Fed in announcing more rate hikes past July in the next week, which in turn can challenge the US Dollar bulls and lure the Gold buyers.
Not only the US data but a recovery in the Treasury bond yields, mainly backed by the downbeat tech sector earnings dragging down the Wall Street benchmarks, also propelled the US Dollar and weighed on the XAU/USD price.
While the US data flashes mixed signals and the yields are also downbeat, irrespective of the latest rebound, headlines from one of the world’s top Gold customers, namely China and India, have been impressive to keep the XAU/USD buyers hopeful.
That said, the People’s Bank of China (PBoC) kept its benchmark Loan Prime Rates (LPRs) unchanged during Thursday’s Interest Rate Decision but took measures to lure global investment. With this, the one-year and five-year LPRs are held intact at 3.55% and 4.20% respectively while the cross-border funding adjustment parameter for firms was lifted to 1.5 from 1.25. The same allows the Chinese institutes to gain international funding with lesser hardships.
On the other hand, the growth prospects from India have been promising of late, which in turn allows the Gold Price to lick its wounds and help the XAU/USD to grind higher despite the latest retreat.
Against this backdrop, the Wall Street benchmark closed in the red while the US Treasury bond yields refresh their weekly low.
Looking forward, a light calendar may allow the Gold Price to consolidate the recent XAU/USD moves should the market sentiment improves. However, the cautious mood ahead of the next week’s monetary policy decision of the ECB and the Fed may not allow the risk appetite, as well as the XAU/USD, to rise much.
Gold Price portrays a lack of bullish momentum as it jostles with a nine-week-old horizontal resistance surrounding $1,985, retreating from a two-month high of late.
That said, the XAU/USD pullback also traces the Relative Strength Index (RSI) line, placed at 14, which stays above the 50.0 level but eases from the multi-day peak of late. The same suggests further bottom-picking in the Gold Price.
As a result, a convergence of the 100-DMA and February’s high near $1,960 appears the short-term key support for the XAU/USD bears to watch.
Following that, a four-month-old horizontal support area near $1,935 can provide headwinds to the Gold sellers. It’s worth noting that an upward-sloping trend line from November 2022, close to $1,920 at the latest, acts as the final defense of the XAU/USD bulls.
On the contrary, a daily closing beyond the $1,985 hurdle could quickly direct the Gold Price toward the $2,000 round figure.
However, March’s high of around $2,010 and April’s peak of $2,048 could challenge the Gold buyers past $2,000, a break of which won’t hesitate to challenge the yearly top surrounding $2,080.
Trend: Bullish
Technical Levels: Supports and Resistances
XAUUSD currently trading at 1970.56 at the time of writing. Pair opened at 1976.75 and is trading with a change of -0.31% % .
| Overview | Overview.1 | |
|---|---|---|
| 0 | Today last price | 1970.56 |
| 1 | Today Daily Change | -6.19 |
| 2 | Today Daily Change % | -0.31% |
| 3 | Today daily open | 1976.75 |
The pair remains strongly bullish on the daily timeframe. It trades above its 20 SMA @ 1932.33, 50 SMA 1951.0, 100 SMA @ 1958.19 and 200 SMA @ 1876.82.
| Trends | Trends.1 | |
|---|---|---|
| 0 | Daily SMA20 | 1932.33 |
| 1 | Daily SMA50 | 1951.00 |
| 2 | Daily SMA100 | 1958.19 |
| 3 | Daily SMA200 | 1876.82 |
The previous day high was 1981.01 while the previous day low was 1969.83. The daily 38.2% Fib levels comes at 1974.1, expected to provide resistance. Similarly, the daily 61.8% fib level is at 1976.74, expected to provide resistance.
Note the levels of interest below:
- Pivot support is noted at 1970.72, 1964.68, 1959.54
- Pivot resistance is noted at 1981.9, 1987.04, 1993.08
| Levels | Levels.1 |
|---|---|
| Previous Daily High | 1981.01 |
| Previous Daily Low | 1969.83 |
| Previous Weekly High | 1963.82 |
| Previous Weekly Low | 1912.74 |
| Previous Monthly High | 1983.50 |
| Previous Monthly Low | 1893.01 |
| Daily Fibonacci 38.2% | 1974.10 |
| Daily Fibonacci 61.8% | 1976.74 |
| Daily Pivot Point S1 | 1970.72 |
| Daily Pivot Point S2 | 1964.68 |
| Daily Pivot Point S3 | 1959.54 |
| Daily Pivot Point R1 | 1981.90 |
| Daily Pivot Point R2 | 1987.04 |
| Daily Pivot Point R3 | 1993.08 |
[/s2If]
Download Nehcap EAWe have two EAs that are operational on our LIVE accounts.
- EA-FIX: Check out the details here. Download EA-FIX . EA-FIX is a non-grid HFT scalper.
- EA-GROWTH: High quality low dd EA using trend grids. Download EA_GROWTHJoin Our Telegram Group
")


