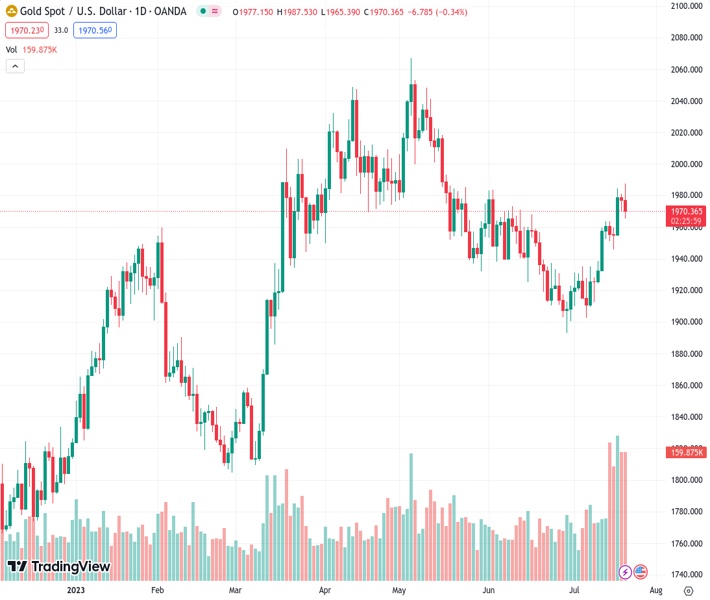
The price of gold in relation to the US dollar is currently at 1,970.49. The latest data on initial unemployment claims in the US revealed a figure of 228,000, surpassing predictions and exceeding the previous numbers of 240,000 and 237,000, respectively.
…
This is a premium post.
[s2If !current_user_can(access_s2member_level4)]Please register for FREE REGISTER to read full post below containing analysis. In case of any error or you think you are not able to read the full post below, please email us at support#nehcap.com [lwa][/s2If] [s2If current_user_can(access_s2member_level1)]
- US Initial Unemployment Claims data came in at 228K, better than forecasts and previous figures of 240K and 237K, respectively.
The pair currently trades last at 1970.49.
The previous day high was 1981.01 while the previous day low was 1969.83. The daily 38.2% Fib levels comes at 1974.1, expected to provide resistance. Similarly, the daily 61.8% fib level is at 1976.74, expected to provide resistance.
Gold price slides from 7-week highs at $1,987.42, as economic data from the United States (US) reignited fears the US Federal Reserve (Fed) would remain tightening conditions past the July meeting. Hence, US Treasury bond yields soared, a headwind for the yellow metal. The XAU/USD is exchanging hands at $1,969.30, down 0.35%.
XAU/USD turned downwards after the US Bureau of Labor Statistics (BLS) revealed that unemployment claims came at 228K, below estimates, and prior’s week, 240K, and 237K, respectively. Although Continuing Claims rose by 33K to 1.754M from 1.721M, the data portray a robust labor market, meaning the Fed would need to act and maintain rates “higher for longer.”
Other data showed the US housing market decelerated, as Existing Home Sales dived -3.3% in June, with sales coming at 4.16M beneath the 4.3M in May and missing 4.2M forecasts.
Given the backdrop, traders are reassessing whether the Fed would raise rates after next week’s Federal Open Market Committee (FOMC) meeting as market participants have priced in a 25 bps hike to 5.25%-5.50%.
According to CME FedWatch Tool, there is a 32.2% chance of the Fed increasing rates to 5.50%-5.75%, from one week 19.8% odds.
Consequently, as shown by the US Dollar Index (DXY), the greenback rose, climbing 0.56% at 100.850, underpinned by high US Treasury bond yields. The US 10-year Treasury note is gaining ten basis points (bps) and yields 3.852%, while US Real Yields, as portrayed by 10-year TIPS, advance five bps to 1.580%.
Therefore, Gold is doomed for the rest of the session as traders await another round of incoming US data. Fears of a worldwide economic slowdown could trigger flows toward safe-haven assets, which could bolster the yellow metal’s appeal. Nevertheless, traders should note that higher US Real yields could dent XAU’s flows in favor of the US Dollar.
From a technical standpoint, XAU/USD is trading neutral to upward biased, as strong resistance around $1985 was difficult to overcome. Prices began trending toward a downslope resistance trendline drawn from May highs, which turned support at around $1,960/70, halting Gold’s drop. If prices extend beyond the latter, key support levels would emerge at the confluence of the 50 and 20-day EMAs a $1,948/47, followed by the 100-day EMA at $1,938.35. Conversely, if XAU/USD surpasses $1,985, that could pave the way to test $2,000.
Technical Levels: Supports and Resistances
XAUUSD currently trading at 1970.49 at the time of writing. Pair opened at 1976.75 and is trading with a change of -0.32 % .
| Overview | Overview.1 | |
|---|---|---|
| 0 | Today last price | 1970.49 |
| 1 | Today Daily Change | -6.26 |
| 2 | Today Daily Change % | -0.32 |
| 3 | Today daily open | 1976.75 |
The pair remains strongly bullish on the daily timeframe. It trades above its 20 SMA @ 1932.33, 50 SMA 1951.0, 100 SMA @ 1958.19 and 200 SMA @ 1876.82.
| Trends | Trends.1 | |
|---|---|---|
| 0 | Daily SMA20 | 1932.33 |
| 1 | Daily SMA50 | 1951.00 |
| 2 | Daily SMA100 | 1958.19 |
| 3 | Daily SMA200 | 1876.82 |
The previous day high was 1981.01 while the previous day low was 1969.83. The daily 38.2% Fib levels comes at 1974.1, expected to provide resistance. Similarly, the daily 61.8% fib level is at 1976.74, expected to provide resistance.
Note the levels of interest below:
- Pivot support is noted at 1970.72, 1964.68, 1959.54
- Pivot resistance is noted at 1981.9, 1987.04, 1993.08
| Levels | Levels.1 |
|---|---|
| Previous Daily High | 1981.01 |
| Previous Daily Low | 1969.83 |
| Previous Weekly High | 1963.82 |
| Previous Weekly Low | 1912.74 |
| Previous Monthly High | 1983.50 |
| Previous Monthly Low | 1893.01 |
| Daily Fibonacci 38.2% | 1974.10 |
| Daily Fibonacci 61.8% | 1976.74 |
| Daily Pivot Point S1 | 1970.72 |
| Daily Pivot Point S2 | 1964.68 |
| Daily Pivot Point S3 | 1959.54 |
| Daily Pivot Point R1 | 1981.90 |
| Daily Pivot Point R2 | 1987.04 |
| Daily Pivot Point R3 | 1993.08 |
[/s2If]
Download Nehcap EAWe have two EAs that are operational on our LIVE accounts.
- EA-FIX: Check out the details here. Download EA-FIX . EA-FIX is a non-grid HFT scalper.
- EA-GROWTH: High quality low dd EA using trend grids. Download EA_GROWTHJoin Our Telegram Group
")


