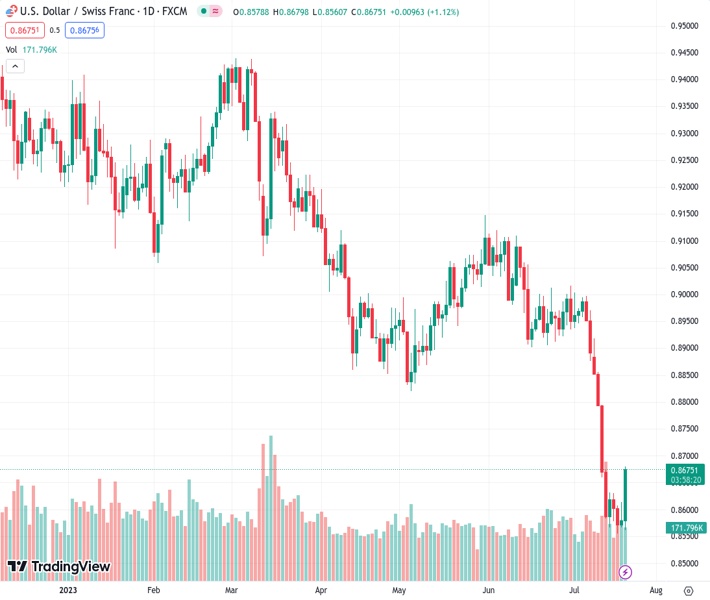
The USD to CHF exchange rate is currently at 0.86755. The number of Initial Jobless Claims for the previous week was 228K, which was considerably lower than the predicted 240K. This suggests that the labor market is strong and there is limited unemployment.
…
This is a premium post.
[s2If !current_user_can(access_s2member_level4)]Please register for FREE REGISTER to read full post below containing analysis. In case of any error or you think you are not able to read the full post below, please email us at support#nehcap.com [lwa][/s2If] [s2If current_user_can(access_s2member_level1)]
- Initial Jobless Claims for the last week came in at 228K, significantly lower than the 240K forecast, indicating a tight labor market.
The pair currently trades last at 0.86755.
The previous day high was 0.8614 while the previous day low was 0.8567. The daily 38.2% Fib levels comes at 0.8596, expected to provide support. Similarly, the daily 61.8% fib level is at 0.8585, expected to provide support.
USD/CHF rallies sharply on Thursday after a solid US jobs report put into the table, another interest rate increase by the US Federal Reserve, past the July meeting. The USD/CHD trades at 0.8669 after hitting a daily low of 0.8560, printing gains of 1.06%.
Two reports emerged from the US economic docket, with the first being the Initial Jobless Claims for the last week, pushing back against the US Federal Reserve’s (Fed) intentions to pause its hiking cycle as the labor market remains tight. Figures came at 228K beneath the 240K forecast, while Continuing Claims, which lagged the current claims week reported, jumped 33K, to 1.754 million, from 1721K.
Recently, Existing Home Sales in June slipped by 3.3%, as shown by the National Association of Realtors. Sales came at 4.16 million, below the 4.3 million in May and beneath the 4.2 million forecasts by analysts.
The USD/CHF soared after the data, as US Treasury bond yields surged, with 2s and 10s soaring ten basis points (bps), each at 4.866%, and 3.860%, respectively. Meanwhile, the US Dollar Index (DXY), which measures the buck’s value vs. six currencies, advances 0.62%, at 100.903, a tailwind for the USD/CHF.
The jump in US bond yields is also a consequence of traders repricing another rate increase by the Fed after the July meeting. Odds for the November meeting increased from 19.8% a week ago to 32.2%, as shown by the CME FedWatch Tool, suggesting traders are switching their point of view regarding Fed’s monetary policy.
On the Switzerland front, the Trade Balance expanded by 4,823 million vs. estimates of 4,031 million but trailed the 5,442 million in May. Exports grew to 24,917 million from 23,879 million in previous readings, whereas the Imports also rose to 20,093M compared to 18,438M marked in May.
That said, the USD/CHF could continue to rally if the US Fed raises rates and keep the door open for another increase, probably in November. That would catch traders off guard, which are already beginning to price in Federal Funds Rate (FFR) cuts by March 2024. Otherwise, the USD/CHF could hover around current exchange rates, awaiting a fresh catalyst.
Technical Levels: Supports and Resistances
USDCHF currently trading at 0.8679 at the time of writing. Pair opened at 0.8585 and is trading with a change of 1.09 % .
| Overview | Overview.1 | |
|---|---|---|
| 0 | Today last price | 0.8679 |
| 1 | Today Daily Change | 0.0094 |
| 2 | Today Daily Change % | 1.0900 |
| 3 | Today daily open | 0.8585 |
The pair remains strongly bearish on the daily time frame. It trades below the 20 SMA @ 0.8839, 50 SMA 0.8946, 100 SMA @ 0.9016 and 200 SMA @ 0.9232.
| Trends | Trends.1 | |
|---|---|---|
| 0 | Daily SMA20 | 0.8839 |
| 1 | Daily SMA50 | 0.8946 |
| 2 | Daily SMA100 | 0.9016 |
| 3 | Daily SMA200 | 0.9232 |
The previous day high was 0.8614 while the previous day low was 0.8567. The daily 38.2% Fib levels comes at 0.8596, expected to provide support. Similarly, the daily 61.8% fib level is at 0.8585, expected to provide support.
Note the levels of interest below:
- Pivot support is noted at 0.8564, 0.8542, 0.8517
- Pivot resistance is noted at 0.861, 0.8635, 0.8657
| Levels | Levels.1 |
|---|---|
| Previous Daily High | 0.8614 |
| Previous Daily Low | 0.8567 |
| Previous Weekly High | 0.8918 |
| Previous Weekly Low | 0.8566 |
| Previous Monthly High | 0.9120 |
| Previous Monthly Low | 0.8902 |
| Daily Fibonacci 38.2% | 0.8596 |
| Daily Fibonacci 61.8% | 0.8585 |
| Daily Pivot Point S1 | 0.8564 |
| Daily Pivot Point S2 | 0.8542 |
| Daily Pivot Point S3 | 0.8517 |
| Daily Pivot Point R1 | 0.8610 |
| Daily Pivot Point R2 | 0.8635 |
| Daily Pivot Point R3 | 0.8657 |
[/s2If]
Download Nehcap EAWe have two EAs that are operational on our LIVE accounts.
- EA-FIX: Check out the details here. Download EA-FIX . EA-FIX is a non-grid HFT scalper.
- EA-GROWTH: High quality low dd EA using trend grids. Download EA_GROWTHJoin Our Telegram Group
")


