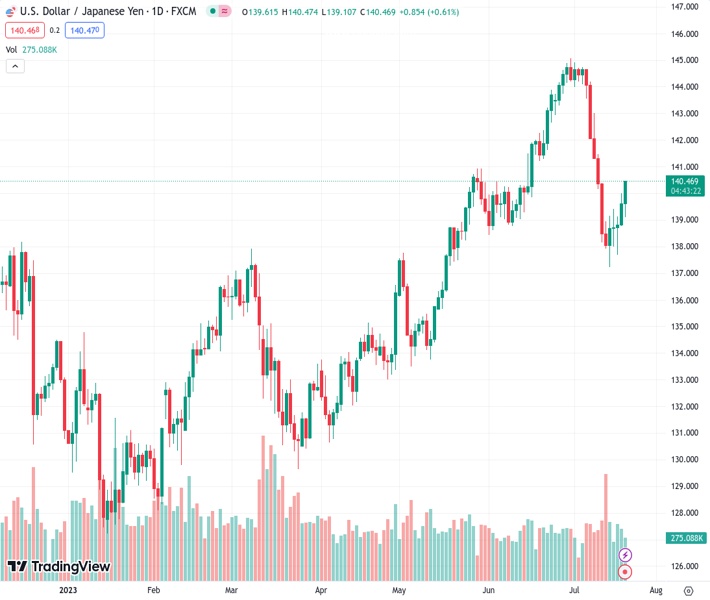
The USDJPY pair, trading at 140.453, saw its value increase for the fifth consecutive day and reached a peak close to 140.40.
…
This is a premium post.
[s2If !current_user_can(access_s2member_level4)]Please register for FREE REGISTER to read full post below containing analysis. In case of any error or you think you are not able to read the full post below, please email us at support#nehcap.com [lwa][/s2If] [s2If current_user_can(access_s2member_level1)]
- USD/JPY tallied a fifth consecutive day of gains rising to a high near 140.40.
The pair currently trades last at 140.453.
The previous day high was 140.0 while the previous day low was 138.77. The daily 38.2% Fib levels comes at 139.53, expected to provide support. Similarly, the daily 61.8% fib level is at 139.24, expected to provide support.
The USD strengthened on Thursday and trades with gains agains most of its rivals, including the EUR, GBP, CHF and JPY. Lower Jobless Claims fueled a rise in US bond yields and allowed the USD measured by the DXY index, to rise to its highest level in seven days at 100.80.
The US reported mid-tier data. On the negative side, the Philadelphia Federal Reserve Manufacturing survey showed worrying results as it index declined more than expected, coming in at -13 vs the consensus of -10. In addition, following Wednesday’s soft Housing data, Existing sales from the US from June also showed weakness. The figure showed a contraction of 3.3% MoM in June with a 4.16M decrease.
That being said, investors are weighing more the lower-than-expected Jobless Claims figures for the second week of July. The number of people filing for unemployment benefits came in at 228,000 vs the 242,000 expected and also below the previous figure of 237,000.
US Treasury yields advanced across the board. The 2-year yield displays nearly 2% gains and stands at 4.88%, while the 5 and 10-year yields rose to 4.10% and 3.84% showing more than 2% increase. Ahead of next week’s Federal Reserve (Fed) meeting, markets have discounted mainly a 25 basis point increase while the odds of another hike past July continue to be low according to World Interest Rate Probabilities (WIRP)
On the Japanese side, investors will eye Japanese inflation figures from June. The headline Consumer Price Index (CPI) is expected to have accelerated to 3.5% YoY in June, while the Core measure to decelerate slightly to 4.2%.
The daily chart indicates that the bulls are gaining ground, marching towards positive territory. As for now, the Relative Strength Index (RSI) points noth but remains in negative territory while the Moving Average Convergence Divergence (MACD) prints lower red bars, indicating at a fading selling momentum.
Resistance levels: 140.70, 141.00, 141.95 (20-day Simple Moving Average)
Support levels: 140.00, 139.60,139.00.
Technical Levels: Supports and Resistances
USDJPY currently trading at 140.39 at the time of writing. Pair opened at 139.61 and is trading with a change of 0.56 % .
| Overview | Overview.1 | |
|---|---|---|
| 0 | Today last price | 140.39 |
| 1 | Today Daily Change | 0.78 |
| 2 | Today Daily Change % | 0.56 |
| 3 | Today daily open | 139.61 |
The pair is trading below its 20 Daily moving average @ 142.11, below its 50 Daily moving average @ 140.4 , above its 100 Daily moving average @ 137.1 and above its 200 Daily moving average @ 136.98
| Trends | Trends.1 | |
|---|---|---|
| 0 | Daily SMA20 | 142.11 |
| 1 | Daily SMA50 | 140.40 |
| 2 | Daily SMA100 | 137.10 |
| 3 | Daily SMA200 | 136.98 |
The previous day high was 140.0 while the previous day low was 138.77. The daily 38.2% Fib levels comes at 139.53, expected to provide support. Similarly, the daily 61.8% fib level is at 139.24, expected to provide support.
Note the levels of interest below:
- Pivot support is noted at 138.92, 138.23, 137.69
- Pivot resistance is noted at 140.15, 140.69, 141.38
| Levels | Levels.1 |
|---|---|
| Previous Daily High | 140.00 |
| Previous Daily Low | 138.77 |
| Previous Weekly High | 143.00 |
| Previous Weekly Low | 137.24 |
| Previous Monthly High | 145.07 |
| Previous Monthly Low | 138.43 |
| Daily Fibonacci 38.2% | 139.53 |
| Daily Fibonacci 61.8% | 139.24 |
| Daily Pivot Point S1 | 138.92 |
| Daily Pivot Point S2 | 138.23 |
| Daily Pivot Point S3 | 137.69 |
| Daily Pivot Point R1 | 140.15 |
| Daily Pivot Point R2 | 140.69 |
| Daily Pivot Point R3 | 141.38 |
[/s2If]
Download Nehcap EAWe have two EAs that are operational on our LIVE accounts.
- EA-FIX: Check out the details here. Download EA-FIX . EA-FIX is a non-grid HFT scalper.
- EA-GROWTH: High quality low dd EA using trend grids. Download EA_GROWTHJoin Our Telegram Group
")


