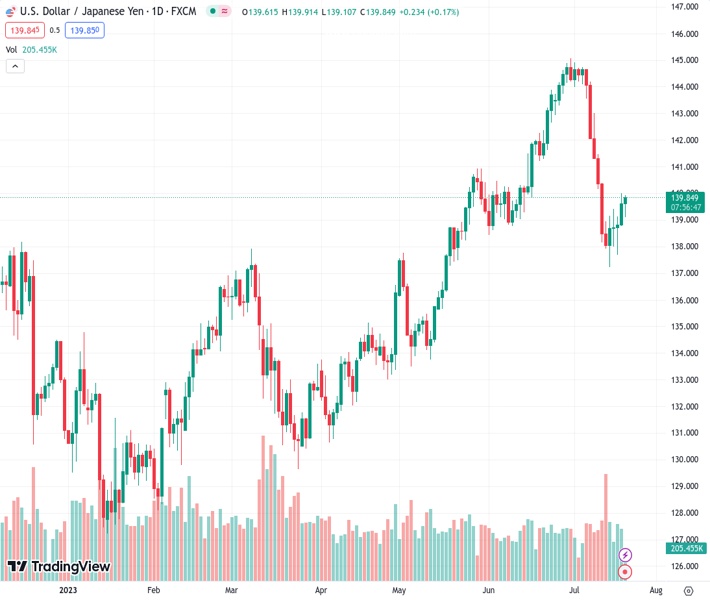
Investors are waiting for Japan’s CPI data in order to receive more guidance, which has resulted in USDJPY consolidating below the 140.00 level.
…
This is a premium post.
[s2If !current_user_can(access_s2member_level4)]Please register for FREE REGISTER to read full post below containing analysis. In case of any error or you think you are not able to read the full post below, please email us at support#nehcap.com [lwa][/s2If] [s2If current_user_can(access_s2member_level1)]
- USD/JPY is consolidating below 140.00 as investors await Japan’s CPI for further guidance.
The pair currently trades last at 139.855.
The previous day high was 140.0 while the previous day low was 138.77. The daily 38.2% Fib levels comes at 139.53, expected to provide support. Similarly, the daily 61.8% fib level is at 139.24, expected to provide support.
The USD/JPY pair is demonstrating topsy-turvy moves below the round-level resistance of 140.00 in the London session. The asset is struggling to find a decisive move as investors need guidance about the interest rate decision from the Federal Reserve (Fed) and the Bank of Japan (BoJ), which will be announced next week.
S&P500 futures have generated some losses ahead of New York’s opening, portraying a cautious market mood. The US Dollar Index (DXY) has rebounded firmly and is aiming to recapture the previous day’s high of 100.53.
Going forward, Japan’s inflation report for June will be in focus, which will be published on Friday. As per the consensus, the headline Consumer Price Index (CPI) increased to 3.5% vs. the former release of 3.2%. Core inflation that excludes volatile oil and food prices softened marginally to 4.2% against the prior release of 4.3%.
USD/JPY has rebounded after testing the breakout of the Ascending Triangle chart pattern formed on a two-hour scale. A breakout of the aforementioned chart pattern results in wider ticks and heavy volume. The 20-period Exponential Moving Average (EMA) at 139.42 is providing a cushion to the US Dollar bulls.
Meanwhile, the Relative Strength Index (RSI) (14) is attempting a break into the bullish range of 60.00-80.00. An occurrence of the same will activate the bullish momentum.
For an upside move, a decisive break above July 19 high around 140.00 would drive the asset towards June 15 high at 141.50 followed by July 10 high at 143.00.
On the flip side, a downside move below July 18 low of 137.68 would expose the asset to May 17 low at 136.30 and May 12 low at 134.40.
Technical Levels: Supports and Resistances
USDJPY currently trading at 139.65 at the time of writing. Pair opened at 139.61 and is trading with a change of 0.03 % .
| Overview | Overview.1 | |
|---|---|---|
| 0 | Today last price | 139.65 |
| 1 | Today Daily Change | 0.04 |
| 2 | Today Daily Change % | 0.03 |
| 3 | Today daily open | 139.61 |
The pair is trading below its 20 Daily moving average @ 142.11, below its 50 Daily moving average @ 140.4 , above its 100 Daily moving average @ 137.1 and above its 200 Daily moving average @ 136.98
| Trends | Trends.1 | |
|---|---|---|
| 0 | Daily SMA20 | 142.11 |
| 1 | Daily SMA50 | 140.40 |
| 2 | Daily SMA100 | 137.10 |
| 3 | Daily SMA200 | 136.98 |
The previous day high was 140.0 while the previous day low was 138.77. The daily 38.2% Fib levels comes at 139.53, expected to provide support. Similarly, the daily 61.8% fib level is at 139.24, expected to provide support.
Note the levels of interest below:
- Pivot support is noted at 138.92, 138.23, 137.69
- Pivot resistance is noted at 140.15, 140.69, 141.38
| Levels | Levels.1 |
|---|---|
| Previous Daily High | 140.00 |
| Previous Daily Low | 138.77 |
| Previous Weekly High | 143.00 |
| Previous Weekly Low | 137.24 |
| Previous Monthly High | 145.07 |
| Previous Monthly Low | 138.43 |
| Daily Fibonacci 38.2% | 139.53 |
| Daily Fibonacci 61.8% | 139.24 |
| Daily Pivot Point S1 | 138.92 |
| Daily Pivot Point S2 | 138.23 |
| Daily Pivot Point S3 | 137.69 |
| Daily Pivot Point R1 | 140.15 |
| Daily Pivot Point R2 | 140.69 |
| Daily Pivot Point R3 | 141.38 |
[/s2If]
Download Nehcap EAWe have two EAs that are operational on our LIVE accounts.
- EA-FIX: Check out the details here. Download EA-FIX . EA-FIX is a non-grid HFT scalper.
- EA-GROWTH: High quality low dd EA using trend grids. Download EA_GROWTHJoin Our Telegram Group
")


