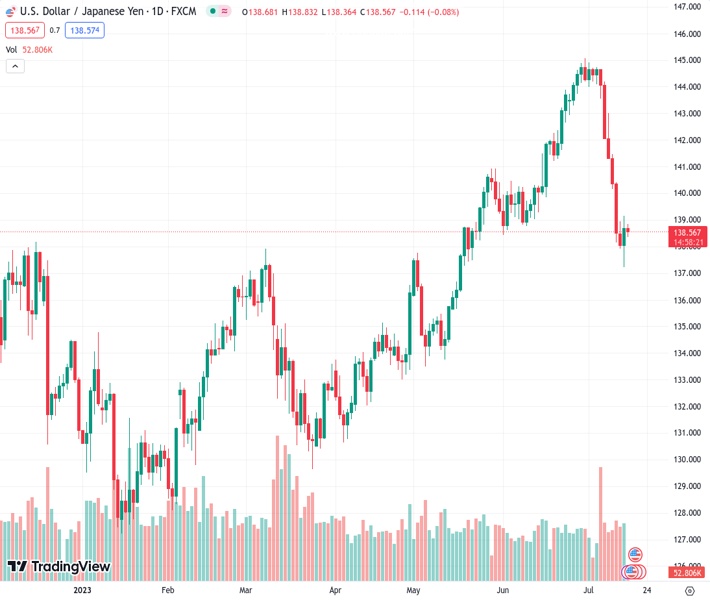
The USDJPY currency pair, currently at 138.595, is reversing the previous day’s temporary recovery from a low point reached two months ago. According to the analysis provided by @nehcap, there is not much expected decline in the value of the pair.
…
This is a premium post.
[s2If !current_user_can(access_s2member_level4)]Please register for FREE REGISTER to read full post below containing analysis. In case of any error or you think you are not able to read the full post below, please email us at support#nehcap.com [lwa][/s2If] [s2If current_user_can(access_s2member_level1)]
- USD/JPY fades the previous day’s corrective bounce off two-month low.
The pair currently trades last at 138.595.
The previous day high was 139.16 while the previous day low was 137.24. The daily 38.2% Fib levels comes at 138.43, expected to provide support. Similarly, the daily 61.8% fib level is at 137.97, expected to provide support.
USD/JPY clings to mild losses around 138.60 as market players seek fresh clues to extend the week-start retreat heading into Monday’s European session. In doing so, the Yen pair fades the previous day’s corrective bounce off the lowest levels since mid-May.
That said, the failure to extend late Friday’s corrective bounce off the multi-day low beyond the previous support line stretched from late March, now immediate resistance around 139.35, recall the USD/JPY sellers.
However, the 50% Fibonacci retracement level of the Yen pair’s up-moves from late March to June, near 137.40, could join the bullish MACD signals and the nearly oversold RSI (14) line to challenge the further downside.
It’s worth noting that early May’s peak of around 137.80 can act as an immediate support for the USD/JPY bears to watch whereas a sustained downside break of 137.40 will make the pair vulnerable to declining towards the 61.8% Fibonacci retracement level, surrounding 135.50.
Alternatively, a clear upside break of the support-turned-resistance line of around 139.35 isn’t an open invitation to the USD/JPY bulls as the 140.00 round figure could act as the additional upside filter.
Above all, the Yen pair remains on the bear’s radar unless witnessing a successful upside break of the convergence of 200-SMA and 23.6% Fibonacci retracement, near 141.50.
Trend: Limited downside expected
Technical Levels: Supports and Resistances
USDJPY currently trading at 138.58 at the time of writing. Pair opened at 138.81 and is trading with a change of -0.17% % .
| Overview | Overview.1 | |
|---|---|---|
| 0 | Today last price | 138.58 |
| 1 | Today Daily Change | -0.23 |
| 2 | Today Daily Change % | -0.17% |
| 3 | Today daily open | 138.81 |
The pair is trading below its 20 Daily moving average @ 142.52, below its 50 Daily moving average @ 140.15 , above its 100 Daily moving average @ 137.02 and above its 200 Daily moving average @ 137.09
| Trends | Trends.1 | |
|---|---|---|
| 0 | Daily SMA20 | 142.52 |
| 1 | Daily SMA50 | 140.15 |
| 2 | Daily SMA100 | 137.02 |
| 3 | Daily SMA200 | 137.09 |
The previous day high was 139.16 while the previous day low was 137.24. The daily 38.2% Fib levels comes at 138.43, expected to provide support. Similarly, the daily 61.8% fib level is at 137.97, expected to provide support.
Note the levels of interest below:
- Pivot support is noted at 137.65, 136.49, 135.73
- Pivot resistance is noted at 139.57, 140.32, 141.49
| Levels | Levels.1 |
|---|---|
| Previous Daily High | 139.16 |
| Previous Daily Low | 137.24 |
| Previous Weekly High | 143.00 |
| Previous Weekly Low | 137.24 |
| Previous Monthly High | 145.07 |
| Previous Monthly Low | 138.43 |
| Daily Fibonacci 38.2% | 138.43 |
| Daily Fibonacci 61.8% | 137.97 |
| Daily Pivot Point S1 | 137.65 |
| Daily Pivot Point S2 | 136.49 |
| Daily Pivot Point S3 | 135.73 |
| Daily Pivot Point R1 | 139.57 |
| Daily Pivot Point R2 | 140.32 |
| Daily Pivot Point R3 | 141.49 |
[/s2If]
Download Nehcap EAWe have two EAs that are operational on our LIVE accounts.
- EA-FIX: Check out the details here. Download EA-FIX . EA-FIX is a non-grid HFT scalper.
- EA-GROWTH: High quality low dd EA using trend grids. Download EA_GROWTHJoin Our Telegram Group


