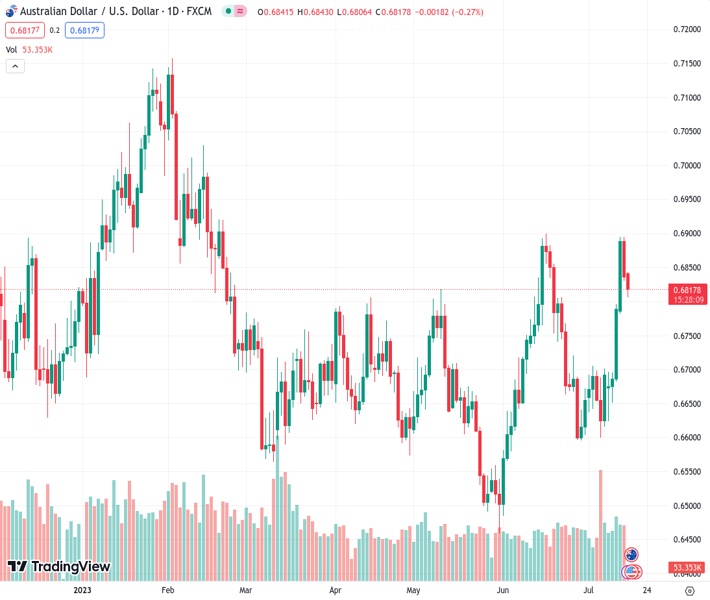
The pair AUDUSD at a rate of 0.68152 has started to receive offers to reduce its losses during a slow trading session.
…
This is a premium post.
[s2If !current_user_can(access_s2member_level4)]Please register for FREE REGISTER to read full post below containing analysis. In case of any error or you think you are not able to read the full post below, please email us at support#nehcap.com [lwa][/s2If] [s2If current_user_can(access_s2member_level1)]
- AUD/USD picks up bids to pare intraday losses amid sluggish session.
The pair currently trades last at 0.68152.
The previous day high was 0.6895 while the previous day low was 0.6831. The daily 38.2% Fib levels comes at 0.6855, expected to provide resistance. Similarly, the daily 61.8% fib level is at 0.687, expected to provide resistance.
AUD/USD bounces off intraday low to 0.6820 heading into Monday’s European session, paring the daily loss amid a sluggish start to the week. Even so, the Aussie pair remains on the back foot for the second consecutive day amid downbeat economic concerns at home, as well as surrounding the major customer China. Also weighing on the Aussie pair could be the market’s consolidation of the US Dollar losses ahead of the late July Fed meeting.
That said, the US Dollar Index (DXY), also known as the USD Index, retreats from the intraday high to 99.95 at the latest. In doing so, the greenback’s gauge versus the six major currencies fade Friday’s corrective bounce off the lowest levels since April 2022, mainly triggered due to the upbeat US sentiment data and inflation expectations figures.
Elsewhere, downbeat China data also weigh on the AUD/USD price, despite the latest consolidation in the pair’s corrective bounce. That said, China’s second quarter (Q2) 2023 Gross Domestic Product (GDP) came in at 0.8% QoQ versus 0.5% market forecasts and 2.2% prior whereas the GDP YoY figures rose past the previous readings of 4.5% to 6.3%, versus analysts’ estimations of 7.3%. Further, the Industrial Production growth jumped to 4.4% YoY in June, compared to the 2.7% expected and 3.5% prior, whereas the Retail Sales slumped to 3.1% from 12.7% prior and 3.2% market consensus. It should be noted that China’s June survey-based Jobless Rate for 24-year-olds jumped to a record high of 21.3%.
On the other hand, mixed concerns about global inflation, flagged by the International Monetary Fund (IMF), renew inflation fears and weighed on the risk appetite amid the pre-Fed blackout period, which in turn weighs on the AUD/USD price.
Furthermore, economic fears flagged by Australian Treasurer Jim Chalmers join the downbeat statistics from major customer China to print mild losses of the AUD/USD pair.
Alternatively, the reopening of the Western markets, after a weekend, allows the US Dollar bears to lick their wounds after the previous day’s corrective bounces.
Additionally, hopes that the Reserve Bank of Australia (RBA) is yet to confirm the dovish trajectory, despite the recently downbeat Aussie statistics, also allow the AUD/USD to rebound from the intraday lows.
Looking ahead, this week’s RBA Minutes and Australian employment data for June will be crucial as the election of Michele Bullock as the next Governor weighs on the AUD/USD price. Also highlighting the Aussie pair’s latest rebound is the market’s preparations for the late July Fed monetary policy decision.
AUD/USD pair portrays a “double top” bearish chart formation around 0.6900, suggesting a pullback in the prices. However, the 200-SMA on the daily chart joins a fortnight-old rising support line, to around 0.6705 and 0.6675 in that order, to restrict the short-term downside of the pair.
Technical Levels: Supports and Resistances
AUDUSD currently trading at 0.6819 at the time of writing. Pair opened at 0.6839 and is trading with a change of -0.29% % .
| Overview | Overview.1 | |
|---|---|---|
| 0 | Today last price | 0.6819 |
| 1 | Today Daily Change | -0.0020 |
| 2 | Today Daily Change % | -0.29% |
| 3 | Today daily open | 0.6839 |
The pair remains strongly bullish on the daily timeframe. It trades above its 20 SMA @ 0.6716, 50 SMA 0.6686, 100 SMA @ 0.6685 and 200 SMA @ 0.6705.
| Trends | Trends.1 | |
|---|---|---|
| 0 | Daily SMA20 | 0.6716 |
| 1 | Daily SMA50 | 0.6686 |
| 2 | Daily SMA100 | 0.6685 |
| 3 | Daily SMA200 | 0.6705 |
The previous day high was 0.6895 while the previous day low was 0.6831. The daily 38.2% Fib levels comes at 0.6855, expected to provide resistance. Similarly, the daily 61.8% fib level is at 0.687, expected to provide resistance.
Note the levels of interest below:
- Pivot support is noted at 0.6815, 0.679, 0.675
- Pivot resistance is noted at 0.6879, 0.6919, 0.6943
| Levels | Levels.1 |
|---|---|
| Previous Daily High | 0.6895 |
| Previous Daily Low | 0.6831 |
| Previous Weekly High | 0.6895 |
| Previous Weekly Low | 0.6624 |
| Previous Monthly High | 0.6900 |
| Previous Monthly Low | 0.6484 |
| Daily Fibonacci 38.2% | 0.6855 |
| Daily Fibonacci 61.8% | 0.6870 |
| Daily Pivot Point S1 | 0.6815 |
| Daily Pivot Point S2 | 0.6790 |
| Daily Pivot Point S3 | 0.6750 |
| Daily Pivot Point R1 | 0.6879 |
| Daily Pivot Point R2 | 0.6919 |
| Daily Pivot Point R3 | 0.6943 |
[/s2If]
Download Nehcap EAWe have two EAs that are operational on our LIVE accounts.
- EA-FIX: Check out the details here. Download EA-FIX . EA-FIX is a non-grid HFT scalper.
- EA-GROWTH: High quality low dd EA using trend grids. Download EA_GROWTHJoin Our Telegram Group


