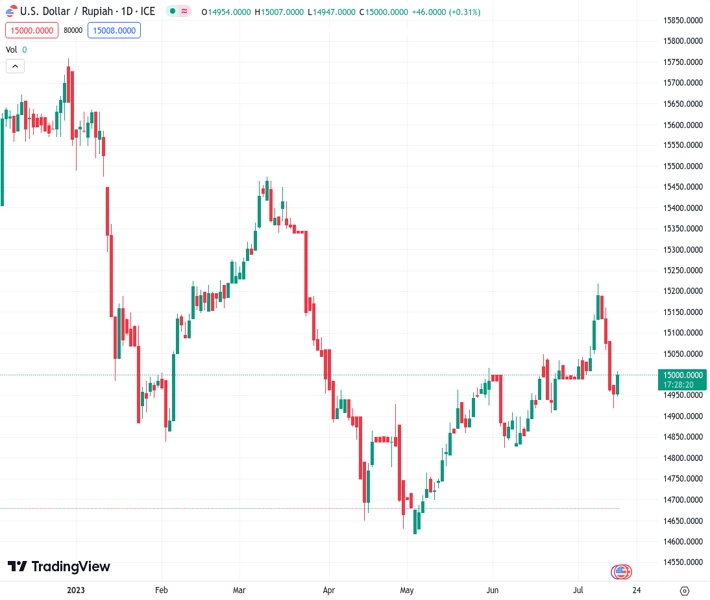
Despite the discouraging trade numbers for June in Indonesia, the USDIDR currency exchange rate at 14,995.0 is finding it difficult to maintain its rebound from Friday.
…
This is a premium post.
[s2If !current_user_can(access_s2member_level4)]Please register for FREE REGISTER to read full post below containing analysis. In case of any error or you think you are not able to read the full post below, please email us at support#nehcap.com [lwa][/s2If] [s2If current_user_can(access_s2member_level1)]
- USD/IDR struggles to defend Friday’s corrective bounce despite downbeat Indonesia trade numbers for June.
The pair currently trades last at 14995.0.
The previous day high was 15004.75 while the previous day low was 13588.0. The daily 38.2% Fib levels comes at 14463.5515, expected to provide support. Similarly, the daily 61.8% fib level is at 14129.1985, expected to provide support.
USD/IDR remains unimpressive around 15,000 as downbeat Indonesia trade numbers jostle with the mixed sentiment during early Monday.
That said, Indonesia’s Exports slumped 21.18% in June versus 0.96% prior and analysts’ estimations of -18.65%. Further details suggest that Imports drop to -18.35% from 14.35%, versus -7.75% expected whereas the Trade Balance suggests a wider surplus of $3.46B versus $1.35B market forecasts and $0.44B prior.
It should be noted that the downbeat prints of China’s second quarter (Q2) 2023 Gross Domestic Product (GDP) joins geopolitical fears surrounding typhoon Talim in Hong Kong, as well as the International Monetary Fund’s (IMF) fears about inflation, weigh on the sentiment and put a floor under the USD/IDR price.
On the same line could be the comments from New Zealand Prime Minister (NZ) Chris Hipkins and US Treasury Secretary Janet Yellen who flagged the looming geopolitical concerns about China and hence weighed on the sentiment, which in turn defends the USD/IDR buyers.
Elsewhere, consolidation in the US Dollar Index (DXY) price amid the pre-Fed blackout, after posting the biggest weekly loss since November 2022, also challenges the USD/IDR bears despite the quote’s latest failure to extend the previous day’s rebound. It’s worth noting that Friday’s preliminary reading of the University of Michigan’s (UoM) Consumer Confidence Index and consumer inflation expectations push back concerns that the Fed is near to the policy pivot and allow the US Dollar to lick its wounds, as well as lure the USD/IDR buyers.
Looking ahead, the risk catalysts will be important to watch for near-term directions amid a light calendar.
USD/IDR recovery remains elusive unless printing a daily closing beyond the 10-week-old support-turned-resistance, around 15,030 by the press time.
Technical Levels: Supports and Resistances
USDIDR currently trading at 15005 at the time of writing. Pair opened at 15003 and is trading with a change of 0.01% % .
| Overview | Overview.1 | |
|---|---|---|
| 0 | Today last price | 15005 |
| 1 | Today Daily Change | 2.0000 |
| 2 | Today Daily Change % | 0.01% |
| 3 | Today daily open | 15003 |
The pair is trading below its 20 Daily moving average @ 15039.6375, above its 50 Daily moving average @ 14945.577 , above its 100 Daily moving average @ 15001.855 and below its 200 Daily moving average @ 15217.0918
| Trends | Trends.1 | |
|---|---|---|
| 0 | Daily SMA20 | 15039.6375 |
| 1 | Daily SMA50 | 14945.5770 |
| 2 | Daily SMA100 | 15001.8550 |
| 3 | Daily SMA200 | 15217.0918 |
The previous day high was 15004.75 while the previous day low was 13588.0. The daily 38.2% Fib levels comes at 14463.5515, expected to provide support. Similarly, the daily 61.8% fib level is at 14129.1985, expected to provide support.
Note the levels of interest below:
- Pivot support is noted at 14059.0833, 13115.1667, 12642.3333
- Pivot resistance is noted at 15475.8333, 15948.6667, 16892.5833
| Levels | Levels.1 |
|---|---|
| Previous Daily High | 15004.7500 |
| Previous Daily Low | 13588.0000 |
| Previous Weekly High | 15916.7000 |
| Previous Weekly Low | 13588.0000 |
| Previous Monthly High | 15087.3500 |
| Previous Monthly Low | 14140.0500 |
| Daily Fibonacci 38.2% | 14463.5515 |
| Daily Fibonacci 61.8% | 14129.1985 |
| Daily Pivot Point S1 | 14059.0833 |
| Daily Pivot Point S2 | 13115.1667 |
| Daily Pivot Point S3 | 12642.3333 |
| Daily Pivot Point R1 | 15475.8333 |
| Daily Pivot Point R2 | 15948.6667 |
| Daily Pivot Point R3 | 16892.5833 |
[/s2If]
Download Nehcap EAWe have two EAs that are operational on our LIVE accounts.
- EA-FIX: Check out the details here. Download EA-FIX . EA-FIX is a non-grid HFT scalper.
- EA-GROWTH: High quality low dd EA using trend grids. Download EA_GROWTHJoin Our Telegram Group


