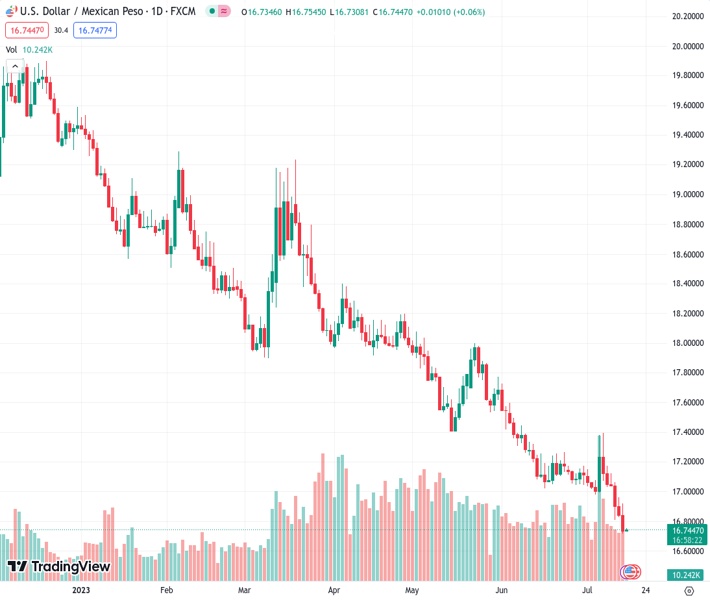
The USDMXN currency pair is currently trading at 16.7452 and has been trading within a tight range close to its lowest point since December 2015.
…
This is a premium post.
[s2If !current_user_can(access_s2member_level4)]Please register for FREE REGISTER to read full post below containing analysis. In case of any error or you think you are not able to read the full post below, please email us at support#nehcap.com [lwa][/s2If] [s2If current_user_can(access_s2member_level1)]
- USD/MXN remains confined in a narrow trading band near its lowest level since December 2015.
The pair currently trades last at 16.7452.
The previous day high was 16.9188 while the previous day low was 16.7167. The daily 38.2% Fib levels comes at 16.7939, expected to provide resistance. Similarly, the daily 61.8% fib level is at 16.8416, expected to provide resistance.
The USD/MXN pair oscillates in a narrow range around the 16.75 region through the Asian session on Monday and consolidates its recent losses to the lowest level since December 2015.
From a technical perspective, the decline witnessed over the past four months or so has been along a downward-sloping channel, which points to a well-established short-term bearish trend. Furthermore, the USD/MXN pair’s inability to attract any meaningful buying suggests that the path of least resistance is to the downside. The negative outlook is reinforced by the underlying bearish sentiment surrounding the US Dollar (USD), led by firming expectations that the Federal Reserve (Fed) is nearing the end of its rate-hiking cycle.
That said, the Relative Strength Index (RSI) on the daily chart is already flashing oversold conditions and warrants some caution before placing fresh bearish bets around the USD/MXN pair. Hence, any subsequent fall below the multi-year low, around the 16.70 region is more likely to find decent support near the lower end of the aforementioned trend-channel, currently pegged near the 16.6240 area. That said, some follow-through selling will mark a fresh breakdown and pave the way for a further near-term depreciating move.
On the flip side, the 16.85-16.90 area now seems to act as an immediate hurdle ahead of the 17.00 round figure. This is followed by resistance near the 17.10-17.15 region, which if cleared might trigger a short-covering move and lift the USD/MXN pair beyond the 17.25 intermediate barrier, towards testing the 17.30-17.35 confluence. The latter comprises the ascending channel resistance and the 50-day Simple Moving Average (SMA) and also nears the monthly swing high. A sustained strength beyond could negate the near-term bearish outlook.
Technical Levels: Supports and Resistances
USDMXN currently trading at 16.7503 at the time of writing. Pair opened at 16.7536 and is trading with a change of -0.02 % .
| Overview | Overview.1 | |
|---|---|---|
| 0 | Today last price | 16.7503 |
| 1 | Today Daily Change | -0.0033 |
| 2 | Today Daily Change % | -0.0200 |
| 3 | Today daily open | 16.7536 |
The pair remains strongly bearish on the daily time frame. It trades below the 20 SMA @ 17.0712, 50 SMA 17.353, 100 SMA @ 17.786 and 200 SMA @ 18.5466.
| Trends | Trends.1 | |
|---|---|---|
| 0 | Daily SMA20 | 17.0712 |
| 1 | Daily SMA50 | 17.3530 |
| 2 | Daily SMA100 | 17.7860 |
| 3 | Daily SMA200 | 18.5466 |
The previous day high was 16.9188 while the previous day low was 16.7167. The daily 38.2% Fib levels comes at 16.7939, expected to provide resistance. Similarly, the daily 61.8% fib level is at 16.8416, expected to provide resistance.
Note the levels of interest below:
- Pivot support is noted at 16.674, 16.5943, 16.4719
- Pivot resistance is noted at 16.876, 16.9984, 17.0781
| Levels | Levels.1 |
|---|---|
| Previous Daily High | 16.9188 |
| Previous Daily Low | 16.7167 |
| Previous Weekly High | 17.1746 |
| Previous Weekly Low | 16.7167 |
| Previous Monthly High | 17.7286 |
| Previous Monthly Low | 17.0243 |
| Daily Fibonacci 38.2% | 16.7939 |
| Daily Fibonacci 61.8% | 16.8416 |
| Daily Pivot Point S1 | 16.6740 |
| Daily Pivot Point S2 | 16.5943 |
| Daily Pivot Point S3 | 16.4719 |
| Daily Pivot Point R1 | 16.8760 |
| Daily Pivot Point R2 | 16.9984 |
| Daily Pivot Point R3 | 17.0781 |
[/s2If]
Download Nehcap EAWe have two EAs that are operational on our LIVE accounts.
- EA-FIX: Check out the details here. Download EA-FIX . EA-FIX is a non-grid HFT scalper.
- EA-GROWTH: High quality low dd EA using trend grids. Download EA_GROWTHJoin Our Telegram Group


