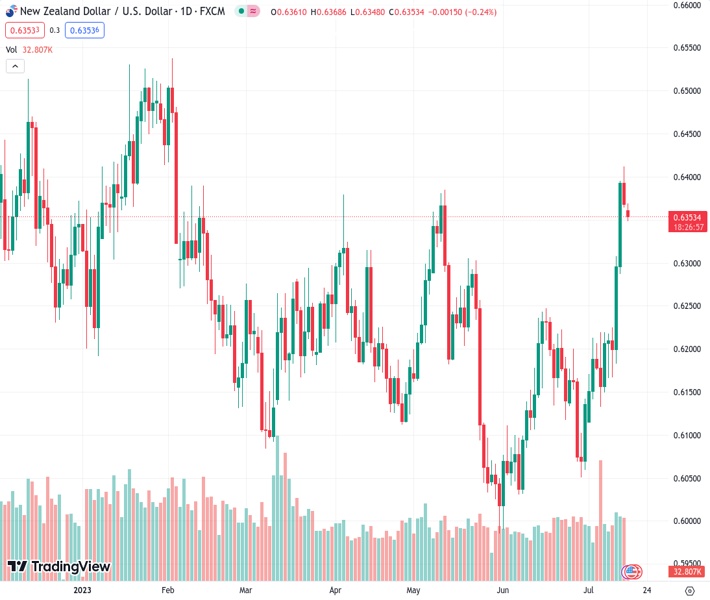
The NZDUSD pair is experiencing continued selling pressure for the second consecutive day on Monday, with a price of 0.63559.
…
This is a premium post.
[s2If !current_user_can(access_s2member_level4)]Please register for FREE REGISTER to read full post below containing analysis. In case of any error or you think you are not able to read the full post below, please email us at support#nehcap.com [lwa][/s2If] [s2If current_user_can(access_s2member_level1)]
- NZD/USD remains under some selling pressure for the second straight day on Monday.
The pair currently trades last at 0.63559.
The previous day high was 0.6413 while the previous day low was 0.6364. The daily 38.2% Fib levels comes at 0.6383, expected to provide resistance. Similarly, the daily 61.8% fib level is at 0.6394, expected to provide resistance.
The NZD/USD pair extends Friday’s modest retracement slide from the 0.6410 area, or its highest level since February and kicks off the new week on a weaker note. Spot prices remain depressed for the second successive day and trade around mid-0.6300s, moving little in reaction to mixed Chinese macro data.
The National Bureau of Statistics of China reported that the economy expanded by 0.8% during the April-June quarter of 2023 as compared to the 0.5% rise anticipated. This, however, marks a notable slowdown from the 2.2% growth recorded in the first quarter. Moreover, the yearly growth rate also fell short of market expectations and came in at 6.3%, though was above the 4.5% increase in the previous quarter.
Separately, China’s Industrial Production surprised to the upside and increased by 4.4% in June against estimates for a moderation to 2.7% from 3.5% in the previous month. This, however, was offset by the fact that China’s Retail Sales decelerated sharply to the 3.1% YoY rate from 12.7% in May. The data does little to ease worries about an economic slowdown or provide any impetus to antipodean currencies, including the Kiwi.
The US Dollar (USD), on the other hand, draws some support from the upbeat University of Michigan (UoM) Consumer Confidence Index released on Friday, which, in turn, is seen acting as a headwind for the NZD/USD pair. That said, any meaningful USD recovery from its lowest level since April 2022 touched on Friday seems elusive in the wake of firming expectations that the Federal Reserve (Fed) will soon end its policy tightening cycle.
This makes it prudent to wait for strong follow-through selling before confirming that the NZD/USD pair has formed a near-term top and placing aggressive bearish bets. Market participants now look to the release of the Empire State Manufacturing Index from the US for some impetus later during the early North American session. In the meantime, a softer risk tone might continue to exert some pressure on the risk-sensitive New Zealand Dollar (NZD).
Technical Levels: Supports and Resistances
NZDUSD currently trading at 0.6359 at the time of writing. Pair opened at 0.6369 and is trading with a change of -0.16 % .
| Overview | Overview.1 | |
|---|---|---|
| 0 | Today last price | 0.6359 |
| 1 | Today Daily Change | -0.0010 |
| 2 | Today Daily Change % | -0.1600 |
| 3 | Today daily open | 0.6369 |
The pair remains strongly bullish on the daily timeframe. It trades above its 20 SMA @ 0.619, 50 SMA 0.6175, 100 SMA @ 0.6193 and 200 SMA @ 0.619.
| Trends | Trends.1 | |
|---|---|---|
| 0 | Daily SMA20 | 0.6190 |
| 1 | Daily SMA50 | 0.6175 |
| 2 | Daily SMA100 | 0.6193 |
| 3 | Daily SMA200 | 0.6190 |
The previous day high was 0.6413 while the previous day low was 0.6364. The daily 38.2% Fib levels comes at 0.6383, expected to provide resistance. Similarly, the daily 61.8% fib level is at 0.6394, expected to provide resistance.
Note the levels of interest below:
- Pivot support is noted at 0.6351, 0.6333, 0.6302
- Pivot resistance is noted at 0.64, 0.6431, 0.6449
| Levels | Levels.1 |
|---|---|
| Previous Daily High | 0.6413 |
| Previous Daily Low | 0.6364 |
| Previous Weekly High | 0.6413 |
| Previous Weekly Low | 0.6166 |
| Previous Monthly High | 0.6250 |
| Previous Monthly Low | 0.5990 |
| Daily Fibonacci 38.2% | 0.6383 |
| Daily Fibonacci 61.8% | 0.6394 |
| Daily Pivot Point S1 | 0.6351 |
| Daily Pivot Point S2 | 0.6333 |
| Daily Pivot Point S3 | 0.6302 |
| Daily Pivot Point R1 | 0.6400 |
| Daily Pivot Point R2 | 0.6431 |
| Daily Pivot Point R3 | 0.6449 |
[/s2If]
Download Nehcap EAWe have two EAs that are operational on our LIVE accounts.
- EA-FIX: Check out the details here. Download EA-FIX . EA-FIX is a non-grid HFT scalper.
- EA-GROWTH: High quality low dd EA using trend grids. Download EA_GROWTHJoin Our Telegram Group


