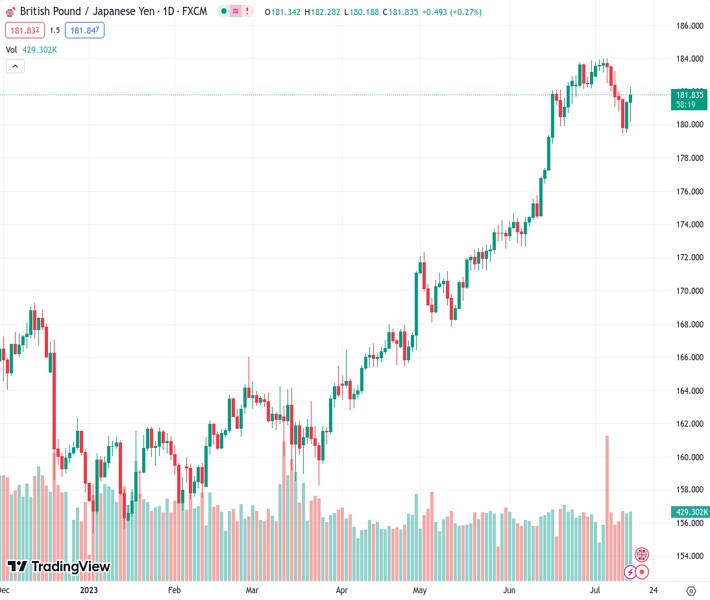
Most of the weekly losses of GBPJPY, which is currently trading close to 181.80, were overcome as a result of increasing British yields.
…
This is a premium post.
[s2If !current_user_can(access_s2member_level4)]Please register for FREE REGISTER to read full post below containing analysis. In case of any error or you think you are not able to read the full post below, please email us at support#nehcap.com [lwa][/s2If] [s2If current_user_can(access_s2member_level1)]
- GBP/JPY cleared most of its weekly losses trading near 181.80 tractioned by rising British yields.
The pair currently trades last at 181.842.
The previous day high was 181.47 while the previous day low was 179.5. The daily 38.2% Fib levels comes at 180.72, expected to provide support. Similarly, the daily 61.8% fib level is at 180.25, expected to provide support.
On Friday, the Sterling traded with gains agains the JPY, but it is still poised to close a weekly decline. However, the GBP/JPY downside potential may be limited while investors are looking for clues on whether the Bank of Japan (BoJ) will tweak its monetary policy in July.
As for now, markets have already largely discounted a 50 basis point (bps) hike in the August 3 Bank of England (BoE) meeting and foresee 25 bps hikes in September, November and in Q1 2024, which would see the policy rate peaking at 6.25% vs the 6.50% terminal rate expected at the beginning of the week.
Despite tightening expectations falling, British bond yields are on the rise and lend support to the GBP. The 2-year bond yield rose more than 1% to 5.19% while the 5-year rate to 4.58%, up by more than 1.50%, while the 10-year rate stands at 4.44%, seeing 0.80% increases.
On the other hand, investors are looking for clues regarding the next Bank of Japan (BoJ) meeting in July. Former bank official Hideo Hayakawa commented that “it is highly probable” that the bank will adjust the Yield Control Curve policy and that if they don’t, “it doesn’t make sense”. Economic data will continue modelling expectations, so traders will eye next week’s Trade Balance data from Japan from June to be reported on Thursday.
Despite two consecutive gains days, the outlook is still negative for the pair. Indicators gained some ground but still show weakness with the Relative Strength Index (RSI) near its midline while the Moving Average Convergence Divergence (MACD) prints red bars. To confirm a recovery, the bulls must retake the 20-day Simple Moving Average (SMA) at 182.25.
Support Levels: 181.00, 180.50, 179.00.
Resistance Levels: 182.25 (20-day SMA), 182.50, 183.00.
Technical Levels: Supports and Resistances
GBPJPY currently trading at 181.89 at the time of writing. Pair opened at 181.34 and is trading with a change of 0.3 % .
| Overview | Overview.1 | |
|---|---|---|
| 0 | Today last price | 181.89 |
| 1 | Today Daily Change | 0.55 |
| 2 | Today Daily Change % | 0.30 |
| 3 | Today daily open | 181.34 |
The pair is trading below its 20 Daily moving average @ 182.32, above its 50 Daily moving average @ 176.65 , above its 100 Daily moving average @ 170.59 and above its 200 Daily moving average @ 167.07
| Trends | Trends.1 | |
|---|---|---|
| 0 | Daily SMA20 | 182.32 |
| 1 | Daily SMA50 | 176.65 |
| 2 | Daily SMA100 | 170.59 |
| 3 | Daily SMA200 | 167.07 |
The previous day high was 181.47 while the previous day low was 179.5. The daily 38.2% Fib levels comes at 180.72, expected to provide support. Similarly, the daily 61.8% fib level is at 180.25, expected to provide support.
Note the levels of interest below:
- Pivot support is noted at 180.06, 178.79, 178.09
- Pivot resistance is noted at 182.04, 182.74, 184.01
| Levels | Levels.1 |
|---|---|
| Previous Daily High | 181.47 |
| Previous Daily Low | 179.50 |
| Previous Weekly High | 184.02 |
| Previous Weekly Low | 182.02 |
| Previous Monthly High | 183.88 |
| Previous Monthly Low | 172.67 |
| Daily Fibonacci 38.2% | 180.72 |
| Daily Fibonacci 61.8% | 180.25 |
| Daily Pivot Point S1 | 180.06 |
| Daily Pivot Point S2 | 178.79 |
| Daily Pivot Point S3 | 178.09 |
| Daily Pivot Point R1 | 182.04 |
| Daily Pivot Point R2 | 182.74 |
| Daily Pivot Point R3 | 184.01 |
[/s2If]
Download Nehcap EAWe have two EAs that are operational on our LIVE accounts.
- EA-FIX: Check out the details here. Download EA-FIX . EA-FIX is a non-grid HFT scalper.
- EA-GROWTH: High quality low dd EA using trend grids. Download EA_GROWTHJoin Our Telegram Group
")


