The XAGUSD pair finishes the week with small improvements, reaching around $25.00, as it achieves its sixth consecutive day of gains.
…
This is a premium post.
[s2If !current_user_can(access_s2member_level4)]Please register for FREE REGISTER to read full post below containing analysis. In case of any error or you think you are not able to read the full post below, please email us at support#nehcap.com [lwa][/s2If] [s2If current_user_can(access_s2member_level1)]
- The XAG/USD closes the week with slight gains near the $25.00 area, tallying a six-day winning streak.
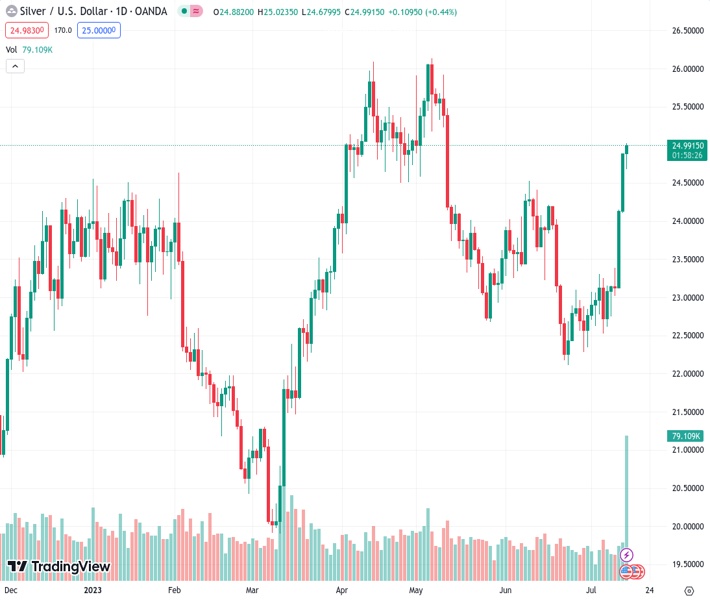
The pair currently trades last at 24.990.
The previous day high was 24.89 while the previous day low was 24.1. The daily 38.2% Fib levels comes at 24.58, expected to provide support. Similarly, the daily 61.8% fib level is at 24.4, expected to provide support.
In Friday’s session, the XAG/USD stands with gains near the $25.00 psychological resistance. Despite US Treasury yields recovering, the precious metal stays resilient while the USD managed to stop the bleeding, still closing its worst week in 2023.
The XAG/USD gained interest due to falling yields during the week. As the US reported that the Core Consumer Price Index (CPI) from the US from June, dropped to 4.8% YoY in June, while the Core Producer Price Index (PPI) slid to 2.6% YoY in the same period, investors started to bet on a less-aggressive Federal Reserve.
As for now, according to the CME FedWatch tool, markets have priced in a 25 basis point (bps) hike in the next Fed meeting in July, but the odds of another hike in 2023 lowered to around 20% vs 40% at the start of the week. In that sense, US yields sharply declined, and as they could be seen as the opportunity cost of holding the non-yielding grey metal, the price rallied.
To close the week, the US yields recovered with more than 1% increases, but the 2, 5 and 10-year yields are set to close a week of more than 3% declines.
The daily chart suggests a positive outlook for the XAG/USD, but after six consecutive days of losses, the price will eventually correct downwards. As for now, the Relative Strength Index (RSI) stands flat near overbought levels, while the Moving Average Convergence Divergence (MACD) seem to be running out of steam.
Resistance Levels: $25.10, $25.40, $26.00.
Support Levels: $23.95, $23.55 (100-day Simple Moving Average), $23.15 (20-day Simple Moving Average).
Technical Levels: Supports and Resistances
XAGUSD currently trading at 24.99 at the time of writing. Pair opened at 24.88 and is trading with a change of 0.44 % .
| Overview | Overview.1 | |
|---|---|---|
| 0 | Today last price | 24.99 |
| 1 | Today Daily Change | 0.11 |
| 2 | Today Daily Change % | 0.44 |
| 3 | Today daily open | 24.88 |
The pair remains strongly bullish on the daily timeframe. It trades above its 20 SMA @ 23.12, 50 SMA 23.6, 100 SMA @ 23.49 and 200 SMA @ 22.75.
| Trends | Trends.1 | |
|---|---|---|
| 0 | Daily SMA20 | 23.12 |
| 1 | Daily SMA50 | 23.60 |
| 2 | Daily SMA100 | 23.49 |
| 3 | Daily SMA200 | 22.75 |
The previous day high was 24.89 while the previous day low was 24.1. The daily 38.2% Fib levels comes at 24.58, expected to provide support. Similarly, the daily 61.8% fib level is at 24.4, expected to provide support.
Note the levels of interest below:
- Pivot support is noted at 24.36, 23.83, 23.57
- Pivot resistance is noted at 25.15, 25.41, 25.93
| Levels | Levels.1 |
|---|---|
| Previous Daily High | 24.89 |
| Previous Daily Low | 24.10 |
| Previous Weekly High | 23.31 |
| Previous Weekly Low | 22.52 |
| Previous Monthly High | 24.53 |
| Previous Monthly Low | 22.11 |
| Daily Fibonacci 38.2% | 24.58 |
| Daily Fibonacci 61.8% | 24.40 |
| Daily Pivot Point S1 | 24.36 |
| Daily Pivot Point S2 | 23.83 |
| Daily Pivot Point S3 | 23.57 |
| Daily Pivot Point R1 | 25.15 |
| Daily Pivot Point R2 | 25.41 |
| Daily Pivot Point R3 | 25.93 |
[/s2If]
Download Nehcap EAWe have two EAs that are operational on our LIVE accounts.
- EA-FIX: Check out the details here. Download EA-FIX . EA-FIX is a non-grid HFT scalper.
- EA-GROWTH: High quality low dd EA using trend grids. Download EA_GROWTHJoin Our Telegram Group
")


