The NZDUSD currency pair, which stands at 0.63778, is moving back from its highest level in five months as traders take profits before the weekend and due to the decreased inflation rate in the United States.
…
This is a premium post.
[s2If !current_user_can(access_s2member_level4)]Please register for FREE REGISTER to read full post below containing analysis. In case of any error or you think you are not able to read the full post below, please email us at support#nehcap.com [lwa][/s2If] [s2If current_user_can(access_s2member_level1)]
- NZD/USD retreats from five-month highs amid profit-taking ahead of the weekend and the backdrop of easing US inflation.
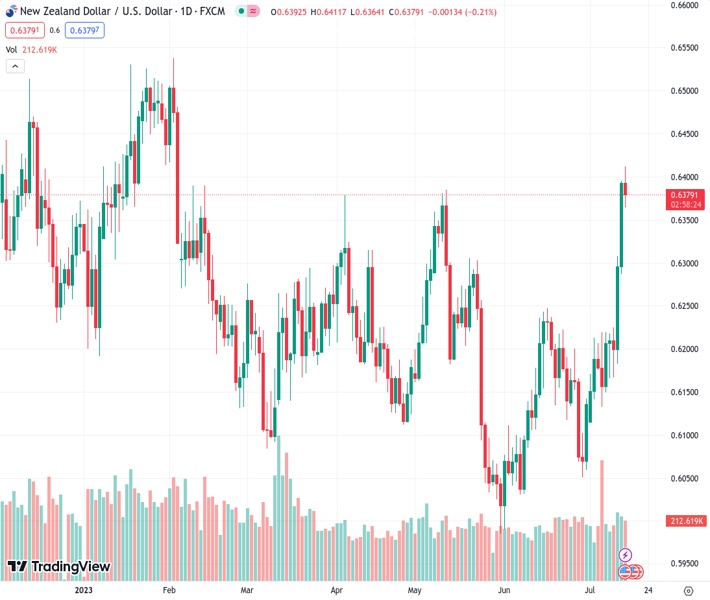
The pair currently trades last at 0.63778.
The previous day high was 0.6396 while the previous day low was 0.6285. The daily 38.2% Fib levels comes at 0.6354, expected to provide support. Similarly, the daily 61.8% fib level is at 0.6327, expected to provide support.
NZD/USD retreats from five-month highs reached at 0.6411 earlier, drops 0.31%, as traders square off their positions ahead of the weekend. US economic data revealed on Friday portrays inflation is easing, while a University of Michigan (UoM) poll showed consumer sentiment improved. The NZD/USD is trading at 0.6372.
During the week, the US economic agenda showcased the Consumer Price Index (CPI) and the Producer Price Index (PPI) June figures, showed the disinflation process is gathering momentum. Hence, investors trimmed a possible rate hike past the July FOMC’s decision, in which the Federal Reserve is expected to lift rates by 25 bps to leave rates at 5.25%-5.50%.
Consequently, US Treasury bond yields plunged, while the greenback holds one of its most significant weekly losses since November 2022, as shown by the US Dollar Index (DXY). As of writing, the DXY, which portrays the US Dollar’s performance against a basket of six currencies, gains 0.17%, up at 99.943.
Data-wise, Friday’s US agenda witnessed Import and Export prices slowing down for the second consecutive month, with figures coming below May’s and analysts’ forecasts. That reinforced US CPI, and PPI data revealed during the week a headwind for the US Dollar.
The University of Michigan (UoM) revealed an improvement in US Consumer Sentiment, which was expected to print 65.5 but came at 72.6m at a two-year high. Further data showed that inflation expectations for one year were upward revised to 3.4% from 3.3% in June, while for five years, it edged high to 3.1%, up from 3%.
Joanne Jsu, the UoM Surveys of Consumers Director, said, “The sharp rise in sentiment was largely attributable to the continued slowdown in inflation along with stability in labor markets.”
On the New Zealand front, the latest Reserve Bank of New Zealand (RBNZ) monetary policy decision to hold rates unchanged didn’t weaken the Kiwi (NZD), which is set to finish the week with solid gains of more than 2.70% against the US Dollar (USD).
The NZD/USD daily chart portrays the pair as upward biased, though it should be said that it is trading below the May 23 daily high of 0.6385, opening the door for further losses. Traders should note the Relative Strength Index (RSI) indicator is exiting overbought territory, which could pave the way for deeper correction while keeping the bias intact.
NZD/USD’s support emerges at a five-month-old broken resistance trendline turned support at around 0.6350/60. A breach of that area, the NZD/USD could dive toward the May 23 high-turned support at 0.6302 before extending its losses to June’s 16 swing high-turned support at 0.6247
Technical Levels: Supports and Resistances
NZDUSD currently trading at 0.6374 at the time of writing. Pair opened at 0.6393 and is trading with a change of -0.3 % .
| Overview | Overview.1 | |
|---|---|---|
| 0 | Today last price | 0.6374 |
| 1 | Today Daily Change | -0.0019 |
| 2 | Today Daily Change % | -0.3000 |
| 3 | Today daily open | 0.6393 |
The pair remains strongly bullish on the daily timeframe. It trades above its 20 SMA @ 0.6182, 50 SMA 0.6174, 100 SMA @ 0.6191 and 200 SMA @ 0.6186.
| Trends | Trends.1 | |
|---|---|---|
| 0 | Daily SMA20 | 0.6182 |
| 1 | Daily SMA50 | 0.6174 |
| 2 | Daily SMA100 | 0.6191 |
| 3 | Daily SMA200 | 0.6186 |
The previous day high was 0.6396 while the previous day low was 0.6285. The daily 38.2% Fib levels comes at 0.6354, expected to provide support. Similarly, the daily 61.8% fib level is at 0.6327, expected to provide support.
Note the levels of interest below:
- Pivot support is noted at 0.632, 0.6247, 0.6209
- Pivot resistance is noted at 0.6431, 0.6469, 0.6542
| Levels | Levels.1 |
|---|---|
| Previous Daily High | 0.6396 |
| Previous Daily Low | 0.6285 |
| Previous Weekly High | 0.6221 |
| Previous Weekly Low | 0.6124 |
| Previous Monthly High | 0.6250 |
| Previous Monthly Low | 0.5990 |
| Daily Fibonacci 38.2% | 0.6354 |
| Daily Fibonacci 61.8% | 0.6327 |
| Daily Pivot Point S1 | 0.6320 |
| Daily Pivot Point S2 | 0.6247 |
| Daily Pivot Point S3 | 0.6209 |
| Daily Pivot Point R1 | 0.6431 |
| Daily Pivot Point R2 | 0.6469 |
| Daily Pivot Point R3 | 0.6542 |
[/s2If]
Download Nehcap EAWe have two EAs that are operational on our LIVE accounts.
- EA-FIX: Check out the details here. Download EA-FIX . EA-FIX is a non-grid HFT scalper.
- EA-GROWTH: High quality low dd EA using trend grids. Download EA_GROWTHJoin Our Telegram Group
")


