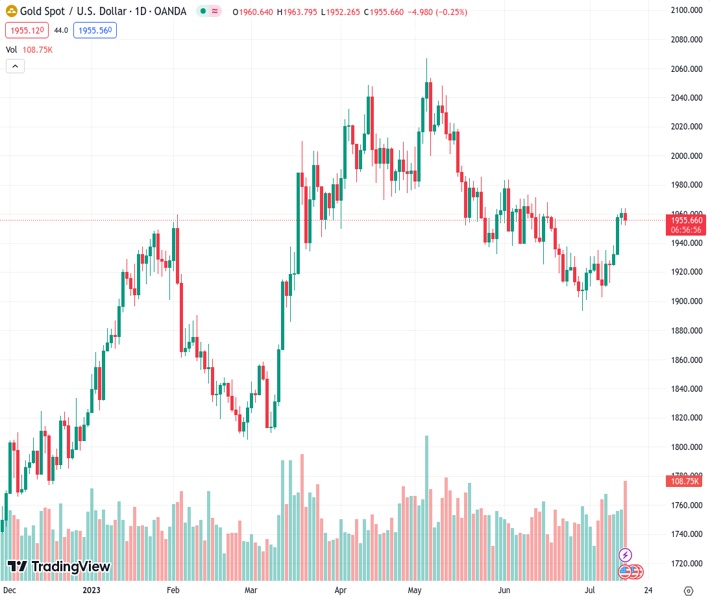
The price of gold, represented by #XAUUSD, has stayed muted at approximately $1,960.00 due to the US Dollar Index making efforts to bounce back.
…
This is a premium post.
[s2If !current_user_can(access_s2member_level4)]Please register for FREE REGISTER to read full post below containing analysis. In case of any error or you think you are not able to read the full post below, please email us at support#nehcap.com [lwa][/s2If] [s2If current_user_can(access_s2member_level1)]
- Gold price has remained subdued around $1,960.00 as the US Dollar Index has attempted a recovery.
The pair currently trades last at 1952.70.
The previous day high was 1963.73 while the previous day low was 1952.45. The daily 38.2% Fib levels comes at 1949.22, expected to provide support. Similarly, the daily 61.8% fib level is at 1942.73, expected to provide support.
Gold price (XAU/USD) is demonstrating a subdued performance around $1,960.00 in the early New York session. The precious metal is struggling to deliver a decisive move as investors are hoping that the Federal Reserve (Fed) might skip the policy-tightening regime one more time this month.
After recognizing a consistent decline in inflationary pressures, Fed chair Jerome Powell skipped its policy-tightening spell in May but remained doors open for more rate hikes. June’s inflation report conveyed that price pressures have softened more than expected as prices of second-hand automobiles have dropped sharply.
Meanwhile, S&P500 is expected to open on a mildly bullish note amid a risk-on mood. The US Dollar Index (DXY) has delivered a short-lived pullback to near 100.00, however, the downside bias is still favored as fundamentals are still not supporting. The yields offered on 10-year US Treasury bonds have rebounded to near 3.79%.
In spite of the decline in price pressures, Fed Governor Christopher Waller delivered a hawkish commentary. Fed Waller is confident that two more interest rate hikes are appropriate this year to bring down inflation to 2%.
Gold price is gathering strength for further upside after a stalwart rally on a two-hour scale. An inventory adjustment is under process as inventory is exchanged between institutional investors and retail participants. Potential resistance is plotted from June 07 high around $1,966.70.
Upward-sloping 20-period Exponential Moving Average (EMA) at $1,956.33 is providing support to the Gold bulls.
The Relative Strength Index (RSI) (14) has slipped below 60.00, which indicates exhaustion in the upside momentum.
Technical Levels: Supports and Resistances
XAUUSD currently trading at 1956.29 at the time of writing. Pair opened at 1960.5 and is trading with a change of -0.21 % .
| Overview | Overview.1 | |
|---|---|---|
| 0 | Today last price | 1956.29 |
| 1 | Today Daily Change | -4.21 |
| 2 | Today Daily Change % | -0.21 |
| 3 | Today daily open | 1960.50 |
The pair is trading above its 20 Daily moving average @ 1927.75, below its 50 Daily moving average @ 1957.53 , above its 100 Daily moving average @ 1950.96 and above its 200 Daily moving average @ 1869.98
| Trends | Trends.1 | |
|---|---|---|
| 0 | Daily SMA20 | 1927.75 |
| 1 | Daily SMA50 | 1957.53 |
| 2 | Daily SMA100 | 1950.96 |
| 3 | Daily SMA200 | 1869.98 |
The previous day high was 1963.73 while the previous day low was 1952.45. The daily 38.2% Fib levels comes at 1949.22, expected to provide support. Similarly, the daily 61.8% fib level is at 1942.73, expected to provide support.
Note the levels of interest below:
- Pivot support is noted at 1939.89, 1922.3, 1912.38
- Pivot resistance is noted at 1967.4, 1977.32, 1994.91
| Levels | Levels.1 |
|---|---|
| Previous Daily High | 1963.73 |
| Previous Daily Low | 1952.45 |
| Previous Weekly High | 1935.09 |
| Previous Weekly Low | 1902.77 |
| Previous Monthly High | 1983.50 |
| Previous Monthly Low | 1893.01 |
| Daily Fibonacci 38.2% | 1949.22 |
| Daily Fibonacci 61.8% | 1942.73 |
| Daily Pivot Point S1 | 1939.89 |
| Daily Pivot Point S2 | 1922.30 |
| Daily Pivot Point S3 | 1912.38 |
| Daily Pivot Point R1 | 1967.40 |
| Daily Pivot Point R2 | 1977.32 |
| Daily Pivot Point R3 | 1994.91 |
[/s2If]
Download Nehcap EAWe have two EAs that are operational on our LIVE accounts.
- EA-FIX: Check out the details here. Download EA-FIX . EA-FIX is a non-grid HFT scalper.
- EA-GROWTH: High quality low dd EA using trend grids. Download EA_GROWTHJoin Our Telegram Group
")


