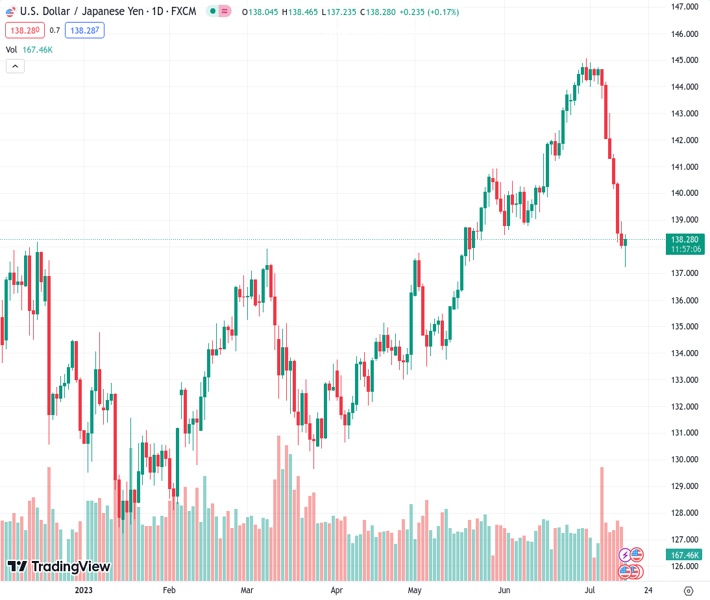
The USDJPY pair, currently at 138.312, has continued to bounce back and is now approaching the 138.50 level, following the movement of the USD Index.
…
This is a premium post.
[s2If !current_user_can(access_s2member_level4)]Please register for FREE REGISTER to read full post below containing analysis. In case of any error or you think you are not able to read the full post below, please email us at support#nehcap.com [lwa][/s2If] [s2If current_user_can(access_s2member_level1)]
- USD/JPY has extended its recovery to near 138.50, tracing action in the USD Index.
The pair currently trades last at 138.312.
The previous day high was 138.96 while the previous day low was 137.92. The daily 38.2% Fib levels comes at 139.01, expected to provide resistance. Similarly, the daily 61.8% fib level is at 139.54, expected to provide resistance.
The USD/JPY pair has stretched its recovery to near 138.50 in the London session. The asset has traced the recovery move by the US Dollar Index (DXY). The USD Index rebounded after a six-day losing spell to near 99.50 as investors have got anxious after hawkish commentary from Federal Reserve (Fed) policymakers.
S&P500 futures are demonstrating a subdued performance in Europe, portraying caution among market participants amid an overall upbeat market mood. US equities were heavily bought on Thursday, supported by a rally in technology stocks. Investors are hoping that tech-savvy stocks could deliver decent figures in the second-quarterly earnings season despite weak performance in Bank and Financial Services Industry (BFSI).
The USD Index has found intermediate support near 99.50 and is gathering strength to recapture the psychological resistance of 100.00. Despite soft price pressures, Fed Governor Christopher Waller believes that two more interest rate hikes are appropriate this year to bring down inflation to 2%. Although inflation is consistently decelerating, the core Consumer Price Index (CPI) at 4.8% is far from the desired rate of 2%.
Meanwhile, data released from the Fed showed that borrowings by commercial banks from the Fed’s emergency lending programs declined slightly straight for the second week. US firms are avoiding credit to dodge high-interest payment obligations.
On the Japanese Yen front, investors are looking for cues on whether the Bank of Japan (BoJ) will continue its ultra-dovish policy stance or tweak its Yield Curve Control (YCC). Apart from that Japanese officials are still observing FX moves despite the recent depreciation in the US Dollar against the Japanese Yen.
Technical Levels: Supports and Resistances
USDJPY currently trading at 138.18 at the time of writing. Pair opened at 138.05 and is trading with a change of 0.09 % .
| Overview | Overview.1 | |
|---|---|---|
| 0 | Today last price | 138.18 |
| 1 | Today Daily Change | 0.13 |
| 2 | Today Daily Change % | 0.09 |
| 3 | Today daily open | 138.05 |
The pair is trading below its 20 Daily moving average @ 142.79, below its 50 Daily moving average @ 139.99 , above its 100 Daily moving average @ 136.96 and above its 200 Daily moving average @ 137.16
| Trends | Trends.1 | |
|---|---|---|
| 0 | Daily SMA20 | 142.79 |
| 1 | Daily SMA50 | 139.99 |
| 2 | Daily SMA100 | 136.96 |
| 3 | Daily SMA200 | 137.16 |
The previous day high was 138.96 while the previous day low was 137.92. The daily 38.2% Fib levels comes at 139.01, expected to provide resistance. Similarly, the daily 61.8% fib level is at 139.54, expected to provide resistance.
Note the levels of interest below:
- Pivot support is noted at 137.64, 136.78, 135.4
- Pivot resistance is noted at 139.88, 141.25, 142.11
| Levels | Levels.1 |
|---|---|
| Previous Daily High | 138.96 |
| Previous Daily Low | 137.92 |
| Previous Weekly High | 144.91 |
| Previous Weekly Low | 142.07 |
| Previous Monthly High | 145.07 |
| Previous Monthly Low | 138.43 |
| Daily Fibonacci 38.2% | 139.01 |
| Daily Fibonacci 61.8% | 139.54 |
| Daily Pivot Point S1 | 137.64 |
| Daily Pivot Point S2 | 136.78 |
| Daily Pivot Point S3 | 135.40 |
| Daily Pivot Point R1 | 139.88 |
| Daily Pivot Point R2 | 141.25 |
| Daily Pivot Point R3 | 142.11 |
[/s2If]
Download Nehcap EAWe have two EAs that are operational on our LIVE accounts.
- EA-FIX: Check out the details here. Download EA-FIX . EA-FIX is a non-grid HFT scalper.
- EA-GROWTH: High quality low dd EA using trend grids. Download EA_GROWTHJoin Our Telegram Group
")


