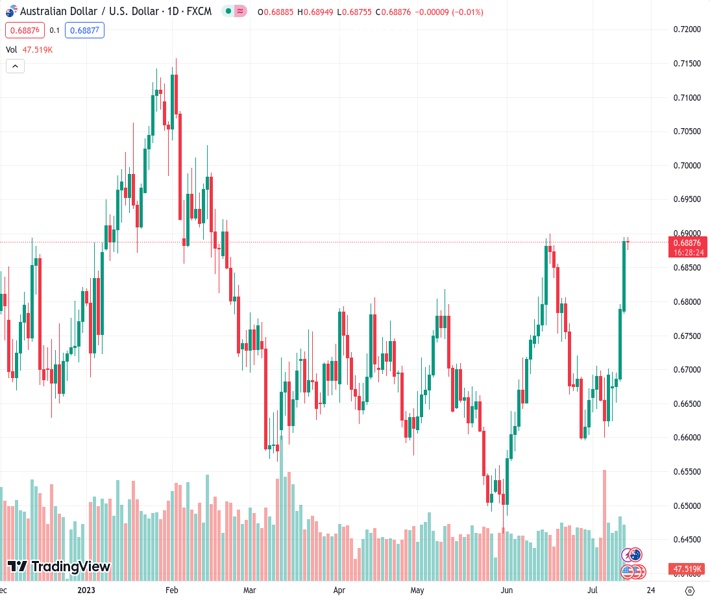
Bulls in #AUDUSD, currently at 0.68859, are momentarily stopping their upward momentum following a recent climb to the highest level seen in almost a month.
…
This is a premium post.
[s2If !current_user_can(access_s2member_level4)]Please register for FREE REGISTER to read full post below containing analysis. In case of any error or you think you are not able to read the full post below, please email us at support#nehcap.com [lwa][/s2If] [s2If current_user_can(access_s2member_level1)]
- AUD/USD bulls take a brief pause after the recent rise to a nearly one-month peak.
The pair currently trades last at 0.68859.
The previous day high was 0.6895 while the previous day low was 0.6785. The daily 38.2% Fib levels comes at 0.6753, expected to provide support. Similarly, the daily 61.8% fib level is at 0.6726, expected to provide support.
The AUD/USD pair is seen consolidating its recent strong gains to a nearly one-month top and oscillating in a narrow trading band through the Asian session on Friday. Bulls now await a sustained strength above the 0.6900 round figure before placing fresh bets and positioning for an extension of the recent rally witnessed over the past week or so, from sub-0.6600 levels or the monthly low.
The US Dollar (USD) remains under some selling pressure for the seventh successive day and hits a fresh low since April 2022 as traders now seem convinced that the Federal Reserve (Fed) is nearing the end of its rate-hiking cycle. This, along with hopes that China will announce more stimulus measures to support the fragile domestic economy, benefits the China-proxy Australian Dollar (AUD) and acts as a tailwind for the AUD./USD pair.
From a technical perspective, the recent breakout through the 0.6800 static barrier and the subsequent move up favour bullish traders. Moreover, oscillators on the daily chart are holding comfortably in the positive territory and are still far from being in the overbought zone. This, in turn, supports prospects for a further near-term appreciating move and an eventual move beyond the 0.6900 mark, or the multi-month top touched in June.
The AUD/USD pair might then accelerate the momentum towards testing the 0.6955-0.6960 intermediate hurdle before aiming to reclaim the 0.7000 psychological mark for the first time since February 14. The next relevant hurdle is pegged near the 0.7025-0.7030 area, above which spot prices could climb further towards the 0.7100 round figure en route to the YTD peak, around the 0.7155-0.7160 region touched in February.
On the flip side, any meaningful corrective fall might now be seen as a buying opportunity near the 0.6835 region. This should help limit the downside near the 0.6800 resistance breakpoint, now turned support. The said handle should act as a pivotal point, which if broken decisively might prompt some technical selling and drag the AUID/USD pair back toward the very important 200-day Simple Moving Average (SMA), around the 0.6700 mark.
Technical Levels: Supports and Resistances
AUDUSD currently trading at 0.6893 at the time of writing. Pair opened at 0.6889 and is trading with a change of 0.06 % .
| Overview | Overview.1 | |
|---|---|---|
| 0 | Today last price | 0.6893 |
| 1 | Today Daily Change | 0.0004 |
| 2 | Today Daily Change % | 0.0600 |
| 3 | Today daily open | 0.6889 |
The pair remains strongly bullish on the daily timeframe. It trades above its 20 SMA @ 0.6718, 50 SMA 0.6681, 100 SMA @ 0.6683 and 200 SMA @ 0.6701.
| Trends | Trends.1 | |
|---|---|---|
| 0 | Daily SMA20 | 0.6718 |
| 1 | Daily SMA50 | 0.6681 |
| 2 | Daily SMA100 | 0.6683 |
| 3 | Daily SMA200 | 0.6701 |
The previous day high was 0.6895 while the previous day low was 0.6785. The daily 38.2% Fib levels comes at 0.6753, expected to provide support. Similarly, the daily 61.8% fib level is at 0.6726, expected to provide support.
Note the levels of interest below:
- Pivot support is noted at 0.6713, 0.6641, 0.6599
- Pivot resistance is noted at 0.6827, 0.6869, 0.6941
| Levels | Levels.1 |
|---|---|
| Previous Daily High | 0.6895 |
| Previous Daily Low | 0.6785 |
| Previous Weekly High | 0.6705 |
| Previous Weekly Low | 0.6599 |
| Previous Monthly High | 0.6900 |
| Previous Monthly Low | 0.6484 |
| Daily Fibonacci 38.2% | 0.6753 |
| Daily Fibonacci 61.8% | 0.6726 |
| Daily Pivot Point S1 | 0.6713 |
| Daily Pivot Point S2 | 0.6641 |
| Daily Pivot Point S3 | 0.6599 |
| Daily Pivot Point R1 | 0.6827 |
| Daily Pivot Point R2 | 0.6869 |
| Daily Pivot Point R3 | 0.6941 |
[/s2If]
Download Nehcap EAWe have two EAs that are operational on our LIVE accounts.
- EA-FIX: Check out the details here. Download EA-FIX . EA-FIX is a non-grid HFT scalper.
- EA-GROWTH: High quality low dd EA using trend grids. Download EA_GROWTHJoin Our Telegram Group
")


