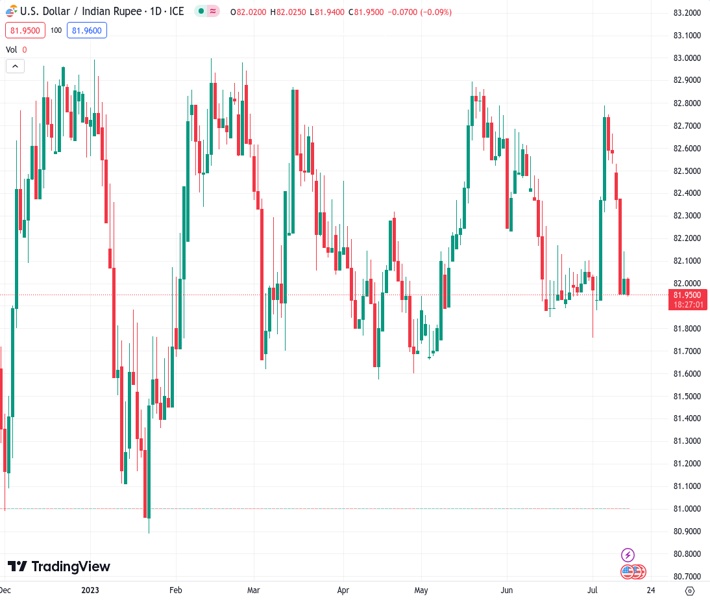
The US dollar against the Indian rupee is currently trading at 81.9400 and is experiencing selling pressure to reverse the recovery it had made from a one-week low the previous day. The viewpoint by @nehcap suggests that there is an anticipation of more downward movement in the future.
…
This is a premium post.
[s2If !current_user_can(access_s2member_level4)]Please register for FREE REGISTER to read full post below containing analysis. In case of any error or you think you are not able to read the full post below, please email us at support#nehcap.com [lwa][/s2If] [s2If current_user_can(access_s2member_level1)]
- USD/INR takes offers to reverse the previous day’s corrective bounce off one-week low.
The pair currently trades last at 81.9400.
The previous day high was 82.1706 while the previous day low was 81.9475. The daily 38.2% Fib levels comes at 82.1559, expected to provide resistance. Similarly, the daily 61.8% fib level is at 82.2741, expected to provide resistance.
USD/INR renews intraday low near 81.96 during Friday morning in India as markets braces for the mid-ties US data to confirm the recently dovish concerns about the Federal Reserve (Fed).
In doing so, the Indian Rupee (INR) pair reverses the previous day’s rebound from the lowest levels since July 05 while extending the early week’s downside break of an ascending trend line from November 2022, around 82.05 by the press time.
Not only the failure to defend the previous day’s corrective bounce but the bearish MACD signals also weigh on the USD/INR price as it keeps the prior trend line breakdown.
With this, the Indian Rupee buyers are likely approaching the monthly low of 81.75 ahead of poking the 200-Exponential Moving Average (EMA) surrounding the 81.70 level.
Following that, a horizontal area around 81.50 comprising the lows marked in April and March appears the last defense of the USD/INR bulls.
On the contrary, the Indian Rupee’s weakness past the 82.05 level encompassing the support-turned-resistance line isn’t an open invitation to the pair buyers.
The reason could be linked to the presence of convergence of the 100-EMA and 23.6% Fibonacci retracement of August-October 2022 upside, near 82.20.
Trend: Further downside expected
Technical Levels: Supports and Resistances
USDINR currently trading at 81.9874 at the time of writing. Pair opened at 82.0201 and is trading with a change of -0.04% % .
| Overview | Overview.1 | |
|---|---|---|
| 0 | Today last price | 81.9874 |
| 1 | Today Daily Change | -0.0327 |
| 2 | Today Daily Change % | -0.04% |
| 3 | Today daily open | 82.0201 |
The pair remains strongly bearish on the daily time frame. It trades below the 20 SMA @ 82.1331, 50 SMA 82.2908, 100 SMA @ 82.2201 and 200 SMA @ 82.184.
| Trends | Trends.1 | |
|---|---|---|
| 0 | Daily SMA20 | 82.1331 |
| 1 | Daily SMA50 | 82.2908 |
| 2 | Daily SMA100 | 82.2201 |
| 3 | Daily SMA200 | 82.1840 |
The previous day high was 82.1706 while the previous day low was 81.9475. The daily 38.2% Fib levels comes at 82.1559, expected to provide resistance. Similarly, the daily 61.8% fib level is at 82.2741, expected to provide resistance.
Note the levels of interest below:
- Pivot support is noted at 81.8147, 81.6391, 81.3137
- Pivot resistance is noted at 82.3157, 82.6411, 82.8167
| Levels | Levels.1 |
|---|---|
| Previous Daily High | 82.1706 |
| Previous Daily Low | 81.9475 |
| Previous Weekly High | 82.8334 |
| Previous Weekly Low | 81.7597 |
| Previous Monthly High | 82.7370 |
| Previous Monthly Low | 81.8477 |
| Daily Fibonacci 38.2% | 82.1559 |
| Daily Fibonacci 61.8% | 82.2741 |
| Daily Pivot Point S1 | 81.8147 |
| Daily Pivot Point S2 | 81.6391 |
| Daily Pivot Point S3 | 81.3137 |
| Daily Pivot Point R1 | 82.3157 |
| Daily Pivot Point R2 | 82.6411 |
| Daily Pivot Point R3 | 82.8167 |
[/s2If]
Download Nehcap EAWe have two EAs that are operational on our LIVE accounts.
- EA-FIX: Check out the details here. Download EA-FIX . EA-FIX is a non-grid HFT scalper.
- EA-GROWTH: High quality low dd EA using trend grids. Download EA_GROWTHJoin Our Telegram Group
")


