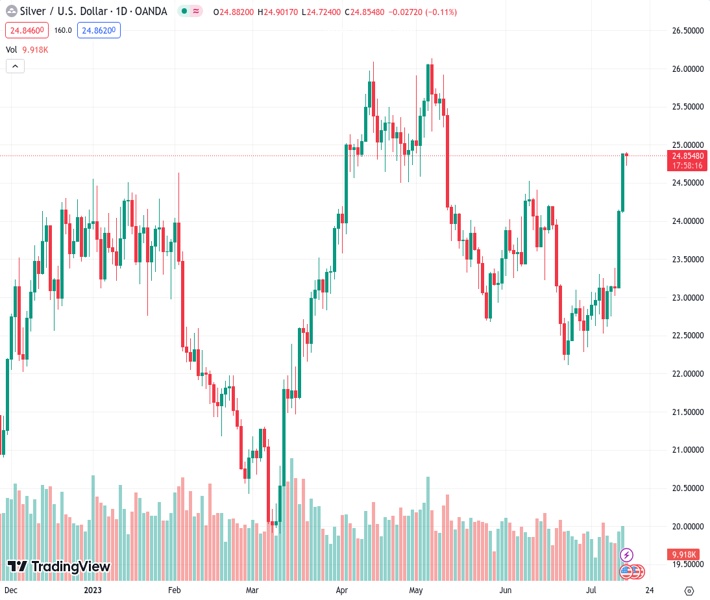
The price of silver, currently at 24.865 for the XAGUSD pair, is fluctuating at its highest point in nine weeks but has experienced its first decrease in three days. The viewpoint of @nehcap suggests that a retreat in the price is anticipated.
…
This is a premium post.
[s2If !current_user_can(access_s2member_level4)]Please register for FREE REGISTER to read full post below containing analysis. In case of any error or you think you are not able to read the full post below, please email us at support#nehcap.com [lwa][/s2If] [s2If current_user_can(access_s2member_level1)]
- Silver Price seesaws at the highest levels in nine weeks, prints the first daily loss in three.
The pair currently trades last at 24.865.
The previous day high was 24.89 while the previous day low was 24.1. The daily 38.2% Fib levels comes at 23.76, expected to provide support. Similarly, the daily 61.8% fib level is at 23.51, expected to provide support.
Silver Price (XAG/USD) retreats from the highest levels since early May, down 0.11% intraday near $24.85 amid the mid-Asian session on Friday. In doing so, the XAG/USD portrays the market’s anxiety ahead of the US consumer-centric data for July while printing the first daily loss in three.
That said, the overbought RSI (14) line joins the 78.6% Fibonacci retracement level of the XAG/USD’s March-September 2022 downturn to challenge the Silver buyers around $24.95.
Even if the bright metal crosses the $24.95 hurdle, the $25.00 round figure can act as an extra check for the bulls before directing them to the 15-month-old horizontal resistance area surrounding $26.10-20.
Following that, the previous yearly high of near $26.95 and the $27.00 threshold will be in the spotlight.
On the contrary, a horizontal area comprising multiple levels marked since January 2023, around $24.65-55, restricts the short-term downside of the Silver Price.
That said, the XAG/USD bears will need validation from the 50-DMA level of around $23.60 to retake control.
Overall, the Silver Price remains on the bull’s radar even if a short-term pullback is expected.
Trend: Pullback expected
Technical Levels: Supports and Resistances
XAGUSD currently trading at 24.84 at the time of writing. Pair opened at 24.88 and is trading with a change of -0.16% % .
| Overview | Overview.1 | |
|---|---|---|
| 0 | Today last price | 24.84 |
| 1 | Today Daily Change | -0.04 |
| 2 | Today Daily Change % | -0.16% |
| 3 | Today daily open | 24.88 |
The pair remains strongly bullish on the daily timeframe. It trades above its 20 SMA @ 23.07, 50 SMA 23.63, 100 SMA @ 23.45 and 200 SMA @ 22.73.
| Trends | Trends.1 | |
|---|---|---|
| 0 | Daily SMA20 | 23.07 |
| 1 | Daily SMA50 | 23.63 |
| 2 | Daily SMA100 | 23.45 |
| 3 | Daily SMA200 | 22.73 |
The previous day high was 24.89 while the previous day low was 24.1. The daily 38.2% Fib levels comes at 23.76, expected to provide support. Similarly, the daily 61.8% fib level is at 23.51, expected to provide support.
Note the levels of interest below:
- Pivot support is noted at 23.44, 22.76, 22.41
- Pivot resistance is noted at 24.48, 24.83, 25.51
| Levels | Levels.1 |
|---|---|
| Previous Daily High | 24.89 |
| Previous Daily Low | 24.10 |
| Previous Weekly High | 23.31 |
| Previous Weekly Low | 22.52 |
| Previous Monthly High | 24.53 |
| Previous Monthly Low | 22.11 |
| Daily Fibonacci 38.2% | 23.76 |
| Daily Fibonacci 61.8% | 23.51 |
| Daily Pivot Point S1 | 23.44 |
| Daily Pivot Point S2 | 22.76 |
| Daily Pivot Point S3 | 22.41 |
| Daily Pivot Point R1 | 24.48 |
| Daily Pivot Point R2 | 24.83 |
| Daily Pivot Point R3 | 25.51 |
[/s2If]
Download Nehcap EAWe have two EAs that are operational on our LIVE accounts.
- EA-FIX: Check out the details here. Download EA-FIX . EA-FIX is a non-grid HFT scalper.
- EA-GROWTH: High quality low dd EA using trend grids. Download EA_GROWTHJoin Our Telegram Group
")


