The USDCAD currency pair is currently at its lowest level in 10 months and is struggling. It is recovering from a three-day downturn and is expected to experience a temporary increase before further declining.
…
This is a premium post.
[s2If !current_user_can(access_s2member_level4)]Please register for FREE REGISTER to read full post below containing analysis. In case of any error or you think you are not able to read the full post below, please email us at support#nehcap.com [lwa][/s2If] [s2If current_user_can(access_s2member_level1)]
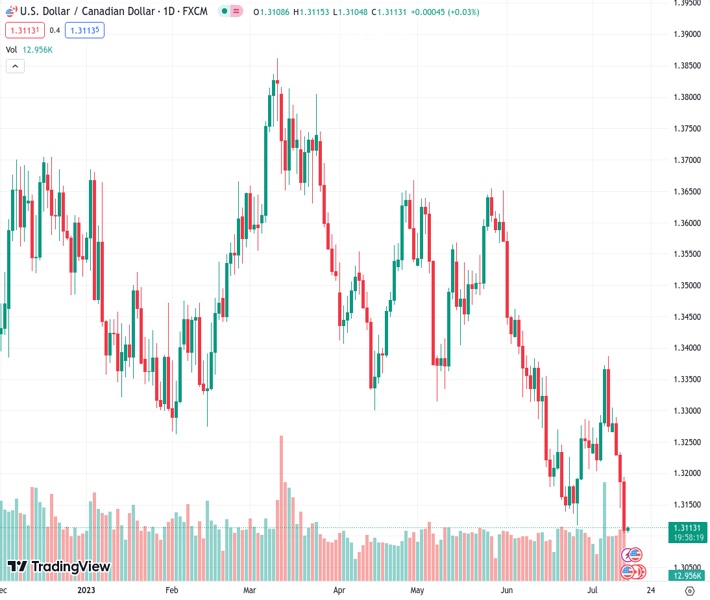
- USD/CAD remains on the back foot at the lowest level in 10 months, licking its wounds after three-day downtrend.
The pair currently trades last at 1.31124.
The previous day high was 1.3195 while the previous day low was 1.3104. The daily 38.2% Fib levels comes at 1.3178, expected to provide resistance. Similarly, the daily 61.8% fib level is at 1.32, expected to provide resistance.
USD/CAD licks its wounds at the lowest level in 10 months, making rounds to 1.3110-3100 during early Friday morning in Asia.
In doing so, the Loonie pair prods the three-day losing streak amid the US Dollar’s corrective bounce ahead of the second-tier US and Canada data, scheduled for publishing on Friday. Notable among them are the preliminary readings of July’s US Michigan Consumer Sentiment Index, as well as the Five-Year Consumer Inflation Expectations. Furthermore, Canada’s Manufacturing Sales for May will also be importat for clear directions.
Apart from the aforementioned catalysts, the bearish MACD signals also exert downside pressure on the USD/CAD price.
However, a convergence of the 200 and 100 SMA on the weekly formation, as well as including an ascending support line from June 2021, together constitute 1.3070 as the key downside support to watch for clear directions.
Although the RSI conditions are nearly overbought and suggest limited downside room for the USD/CAD pair, a clear break of 1.3070 will make the pair vulnerable to declining towards the 1.3000 psychological magnet and then to the September 2022 bottom of around 1.2950.
On the flip side, a weekly close beyond the November 2022 low of near 1.3230 becomes necessary to recall the short-term USD/CAD bulls.
Even so, the monthly high and a downward-sloping resistance line from early March, respectively near 1.3390 and 1.3540, can challenge the USD/CAD buyers before giving them control.
Trend: Corrective bounce expected
Technical Levels: Supports and Resistances
USDCAD currently trading at 1.3113 at the time of writing. Pair opened at 1.3109 and is trading with a change of 0.03% % .
| Overview | Overview.1 | |
|---|---|---|
| 0 | Today last price | 1.3113 |
| 1 | Today Daily Change | 0.0004 |
| 2 | Today Daily Change % | 0.03% |
| 3 | Today daily open | 1.3109 |
The pair remains strongly bearish on the daily time frame. It trades below the 20 SMA @ 1.3228, 50 SMA 1.337, 100 SMA @ 1.348 and 200 SMA @ 1.3498.
| Trends | Trends.1 | |
|---|---|---|
| 0 | Daily SMA20 | 1.3228 |
| 1 | Daily SMA50 | 1.3370 |
| 2 | Daily SMA100 | 1.3480 |
| 3 | Daily SMA200 | 1.3498 |
The previous day high was 1.3195 while the previous day low was 1.3104. The daily 38.2% Fib levels comes at 1.3178, expected to provide resistance. Similarly, the daily 61.8% fib level is at 1.32, expected to provide resistance.
Note the levels of interest below:
- Pivot support is noted at 1.3143, 1.3098, 1.3053
- Pivot resistance is noted at 1.3233, 1.3279, 1.3323
| Levels | Levels.1 |
|---|---|
| Previous Daily High | 1.3195 |
| Previous Daily Low | 1.3104 |
| Previous Weekly High | 1.3387 |
| Previous Weekly Low | 1.3203 |
| Previous Monthly High | 1.3585 |
| Previous Monthly Low | 1.3117 |
| Daily Fibonacci 38.2% | 1.3178 |
| Daily Fibonacci 61.8% | 1.3200 |
| Daily Pivot Point S1 | 1.3143 |
| Daily Pivot Point S2 | 1.3098 |
| Daily Pivot Point S3 | 1.3053 |
| Daily Pivot Point R1 | 1.3233 |
| Daily Pivot Point R2 | 1.3279 |
| Daily Pivot Point R3 | 1.3323 |
[/s2If]
Download Nehcap EAWe have two EAs that are operational on our LIVE accounts.
- EA-FIX: Check out the details here. Download EA-FIX . EA-FIX is a non-grid HFT scalper.
- EA-GROWTH: High quality low dd EA using trend grids. Download EA_GROWTHJoin Our Telegram Group
")


