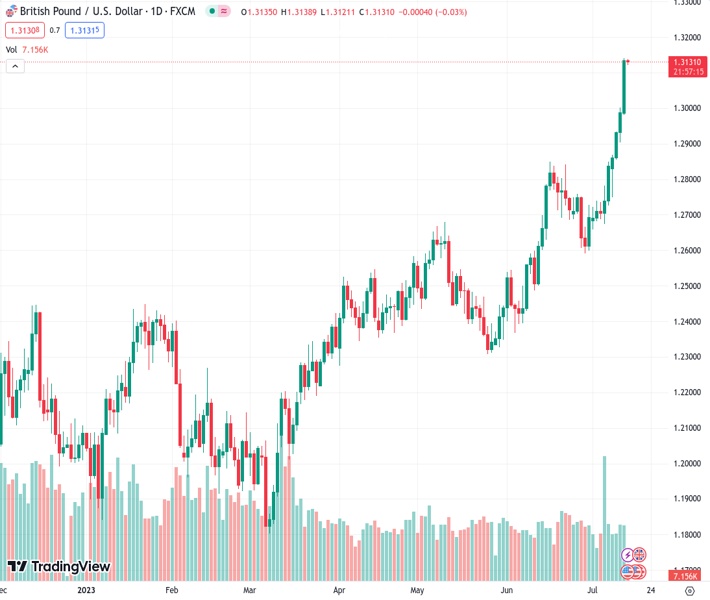
The GBP/USD currency pair fluctuated at its highest level since April 2022, breaking its six-day consecutive upward trend. Nehcap predicts that there will be minimal further gains in the near future.
…
This is a premium post.
[s2If !current_user_can(access_s2member_level4)]Please register for FREE REGISTER to read full post below containing analysis. In case of any error or you think you are not able to read the full post below, please email us at support#nehcap.com [lwa][/s2If] [s2If current_user_can(access_s2member_level1)]
- GBP/USD seesaws at the highest level since April 2022, pauses six-day uptrend.
The pair currently trades last at 1.31289.
The previous day high was 1.3001 while the previous day low was 1.2904. The daily 38.2% Fib levels comes at 1.2964, expected to provide support. Similarly, the daily 61.8% fib level is at 1.2941, expected to provide support.
GBP/USD makes rounds to 1.3130-40 after refreshing a 15-month high as it awaits fresh clues during the early hours of Friday’s Asian session. In doing so, the Cable pair takes clues from the overbought RSI conditions while portraying the trader’s cautious mood at the key upside hurdle.
Also read: GBP/USD rally breaks 1.3100 barrier amid soft US PPI data
That said, December 2021 bottom surrounding 1.3160 restricts the immediate upside of the Pound Sterling pair at the multi-month high, amid the overbought RSI (14) line, suggesting a pullback toward the 78.6% Fibonacci retracement of the January-September 2022 downturn, near 1.3030.
However, the Pound Sterling buyers remain hopeful unless the quote stays beyond the previous resistance line stretched from early May 2023, around 1.2970 by the press time.
Following that, the previous monthly high of around 1.2850 and May’s peak of 1.2680 could lure the GBP/USD sellers.
Meanwhile, the Cable buyer’s ability to cross the 1.3160 hurdle could quickly propel the price toward the March 2022 high surrounding 1.3300.
Though, January 2022 low near 1.3360-55 and multiple tops marked in early 2022 around 1.3650 may prod the GBP/USD bulls before directing them to the previous yearly top of near 1.3750.
Trend: Limited upside expected
Technical Levels: Supports and Resistances
GBPUSD currently trading at 1.3135 at the time of writing. Pair opened at 1.2987 and is trading with a change of 1.14% % .
| Overview | Overview.1 | |
|---|---|---|
| 0 | Today last price | 1.3135 |
| 1 | Today Daily Change | 0.0148 |
| 2 | Today Daily Change % | 1.14% |
| 3 | Today daily open | 1.2987 |
The pair remains strongly bullish on the daily timeframe. It trades above its 20 SMA @ 1.2764, 50 SMA 1.2599, 100 SMA @ 1.2438 and 200 SMA @ 1.2181.
| Trends | Trends.1 | |
|---|---|---|
| 0 | Daily SMA20 | 1.2764 |
| 1 | Daily SMA50 | 1.2599 |
| 2 | Daily SMA100 | 1.2438 |
| 3 | Daily SMA200 | 1.2181 |
The previous day high was 1.3001 while the previous day low was 1.2904. The daily 38.2% Fib levels comes at 1.2964, expected to provide support. Similarly, the daily 61.8% fib level is at 1.2941, expected to provide support.
Note the levels of interest below:
- Pivot support is noted at 1.2927, 1.2867, 1.283
- Pivot resistance is noted at 1.3024, 1.306, 1.312
| Levels | Levels.1 |
|---|---|
| Previous Daily High | 1.3001 |
| Previous Daily Low | 1.2904 |
| Previous Weekly High | 1.2850 |
| Previous Weekly Low | 1.2659 |
| Previous Monthly High | 1.2848 |
| Previous Monthly Low | 1.2369 |
| Daily Fibonacci 38.2% | 1.2964 |
| Daily Fibonacci 61.8% | 1.2941 |
| Daily Pivot Point S1 | 1.2927 |
| Daily Pivot Point S2 | 1.2867 |
| Daily Pivot Point S3 | 1.2830 |
| Daily Pivot Point R1 | 1.3024 |
| Daily Pivot Point R2 | 1.3060 |
| Daily Pivot Point R3 | 1.3120 |
[/s2If]
Download Nehcap EAWe have two EAs that are operational on our LIVE accounts.
- EA-FIX: Check out the details here. Download EA-FIX . EA-FIX is a non-grid HFT scalper.
- EA-GROWTH: High quality low dd EA using trend grids. Download EA_GROWTHJoin Our Telegram Group
")


