The AUDJPY currency pair, trading at a rate of 95.1000, experiences a 1% increase and breaks through the Tenkan-Sen line, revealing the Kijun-Sen line.
…
This is a premium post.
[s2If !current_user_can(access_s2member_level4)]Please register for FREE REGISTER to read full post below containing analysis. In case of any error or you think you are not able to read the full post below, please email us at support#nehcap.com [lwa][/s2If] [s2If current_user_can(access_s2member_level1)]
- AUD/JPY gains 1% and breaches the Tenkan-Sen line, exposing the Kijun-Sen.
The pair currently trades last at 95.1000.
The previous day high was 94.22 while the previous day low was 93.27. The daily 38.2% Fib levels comes at 93.86, expected to provide support. Similarly, the daily 61.8% fib level is at 93.63, expected to provide support.
AUD/JPY reversed its downtrend, and rallied sharply on Thursday, gaining more than 1%, or 106 pips, courtesy of a risk-on impulse due to cooling US inflation and a break of a technical resistance level that has turned support. As the Asian session begins, the AUD/JPY is trading at 95.08, almost flat.
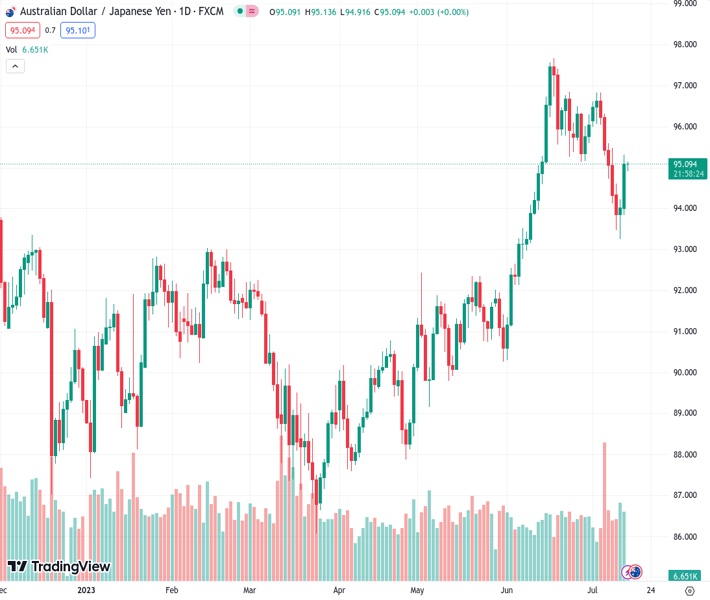
The daily chart portrays the AUD/JPY as upward biased but hovering above/below the Tenkan-Sen line at 95.04. Price action witnessed the pair bouncing slightly below the June 7 high of 93.52, a guarded area for Aussie (AUD) bulls, forming a hammer candlestick on Wednesday. That, alongside Thursday’s long bullish and Tuesday’s bearish candles, formed a three-candlestick pattern, ‘morning star,’ indicating that further upside is expected.
AUD/JPY’s next resistance emerges at the Kijun-Sen line at 95.08, followed by the October 21 daily high at 95.74. The 96.00 figure would be up next, followed by the July 4 high at 96.84, before the pair attacks the 97.00 mark.
For a bearish resumption, AUD/JPY sellers need prices to dive below 95.00 as they eye the current week’s low of 93.25.
AUD/JPY Price Action – Daily chart
Technical Levels: Supports and Resistances
AUDJPY currently trading at 95.09 at the time of writing. Pair opened at 93.99 and is trading with a change of 1.17 % .
| Overview | Overview.1 | |
|---|---|---|
| 0 | Today last price | 95.09 |
| 1 | Today Daily Change | 1.10 |
| 2 | Today Daily Change % | 1.17 |
| 3 | Today daily open | 93.99 |
The pair is trading below its 20 Daily moving average @ 95.91, above its 50 Daily moving average @ 93.52 , above its 100 Daily moving average @ 91.53 and above its 200 Daily moving average @ 91.83
| Trends | Trends.1 | |
|---|---|---|
| 0 | Daily SMA20 | 95.91 |
| 1 | Daily SMA50 | 93.52 |
| 2 | Daily SMA100 | 91.53 |
| 3 | Daily SMA200 | 91.83 |
The previous day high was 94.22 while the previous day low was 93.27. The daily 38.2% Fib levels comes at 93.86, expected to provide support. Similarly, the daily 61.8% fib level is at 93.63, expected to provide support.
Note the levels of interest below:
- Pivot support is noted at 93.44, 92.88, 92.5
- Pivot resistance is noted at 94.38, 94.77, 95.32
| Levels | Levels.1 |
|---|---|
| Previous Daily High | 94.22 |
| Previous Daily Low | 93.27 |
| Previous Weekly High | 96.84 |
| Previous Weekly Low | 94.74 |
| Previous Monthly High | 97.68 |
| Previous Monthly Low | 90.30 |
| Daily Fibonacci 38.2% | 93.86 |
| Daily Fibonacci 61.8% | 93.63 |
| Daily Pivot Point S1 | 93.44 |
| Daily Pivot Point S2 | 92.88 |
| Daily Pivot Point S3 | 92.50 |
| Daily Pivot Point R1 | 94.38 |
| Daily Pivot Point R2 | 94.77 |
| Daily Pivot Point R3 | 95.32 |
[/s2If]
Download Nehcap EAWe have two EAs that are operational on our LIVE accounts.
- EA-FIX: Check out the details here. Download EA-FIX . EA-FIX is a non-grid HFT scalper.
- EA-GROWTH: High quality low dd EA using trend grids. Download EA_GROWTHJoin Our Telegram Group
")


