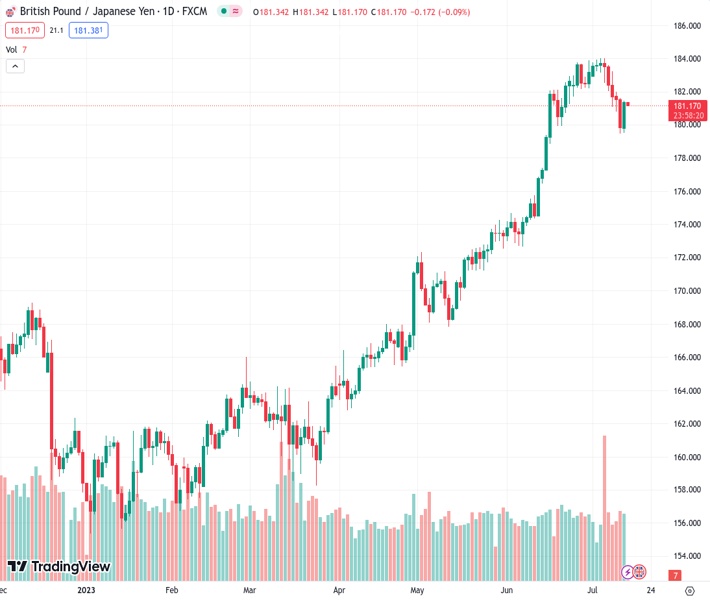
#GBPJPY @ 181.253 After five days of losses, the managed to jump above 181.00 on Thursday.
…
This is a premium post.
[s2If !current_user_can(access_s2member_level4)]Please register for FREE REGISTER to read full post below containing analysis. In case of any error or you think you are not able to read the full post below, please email us at support#nehcap.com [lwa][/s2If] [s2If current_user_can(access_s2member_level1)]
- After five days of losses, the GBP/JPY managed to jump above 181.00 on Thursday.
The pair currently trades last at 181.253.
The previous day high was 181.56 while the previous day low was 179.47. The daily 38.2% Fib levels comes at 180.27, expected to provide support. Similarly, the daily 61.8% fib level is at 180.76, expected to provide support.
The GBP/JPY gains ground despite weak economic figures from the UK. Investors continue to bet on an aggressive Bank of England (BoE), which limits the Pound’s losses, while the expectations of a pivot of the Bank of Japan (BoJ) support the Yen.
The Office for National Statistics (ONS) revealed that the UK’s Gross Domestic Product (GDP) declined slower than expected in May at 0.1% MoM vs the expectations of 0.3%. The Manufacturing production saw similar results as they also contracted by 0.2% MoM in the same period but lower than the expectations of 0.5%. Finally, Industrial Production declined, but at a higher pace than expected at 0.6% vs 0.4% MoM in the same period.
The U.K. is undoubtedly moving towards a recession as the Bank of England tightens its monetary policy, and the economy weakens. In addition, the GDP has experienced a monthly contraction for the first time since March 2021.
Despite weak economic data, according to the World Interest Rate Probabilities (WIRP), the markets have already priced in a 50 basis points (bps) interest rate hike for August 3rd. However, the expectations have shifted for the subsequent hikes as a 25 bps increase is currently priced in for September 21st, as opposed to the initial projection of a 50 bps hike earlier in the week.
On the Japanese side, the JPY may limit its losses on the back of a Yield Control Curve (YCC) policy pivot by the Bank of Japan (BoJ). Masato Kanda, a currency diplomat from Japan, acknowledged that the prevailing deflationary trends “might be changing”. Its worth noticing that rising wages may contribute to an increase in inflationary pressures, but the Bank shouldn’t disregard China’s economic situation, which is showing signs of weakness, as it could further weaken the local economy.
Despite indicators gaining ground, the short-term outlook favours the Yen over the GBP. The Relative Strength Index (RSI) shows strong downward momentum despite standing in positive territory. At the same time, the Moving Average Convergence Divergence (MACD) prints higher red bars indicating that the bears are in command.
Support Levels: 181.00, 180.50, 179.00.
Resistance Levels: 182.25 (20-day SMA), 182.50, 183.00.
Technical Levels: Supports and Resistances
GBPJPY currently trading at 181.32 at the time of writing. Pair opened at 179.88 and is trading with a change of 0.8 % .
| Overview | Overview.1 | |
|---|---|---|
| 0 | Today last price | 181.32 |
| 1 | Today Daily Change | 1.44 |
| 2 | Today Daily Change % | 0.80 |
| 3 | Today daily open | 179.88 |
The pair is trading below its 20 Daily moving average @ 182.23, above its 50 Daily moving average @ 176.4 , above its 100 Daily moving average @ 170.4 and above its 200 Daily moving average @ 166.97
| Trends | Trends.1 | |
|---|---|---|
| 0 | Daily SMA20 | 182.23 |
| 1 | Daily SMA50 | 176.40 |
| 2 | Daily SMA100 | 170.40 |
| 3 | Daily SMA200 | 166.97 |
The previous day high was 181.56 while the previous day low was 179.47. The daily 38.2% Fib levels comes at 180.27, expected to provide support. Similarly, the daily 61.8% fib level is at 180.76, expected to provide support.
Note the levels of interest below:
- Pivot support is noted at 179.05, 178.22, 176.96
- Pivot resistance is noted at 181.14, 182.39, 183.23
| Levels | Levels.1 |
|---|---|
| Previous Daily High | 181.56 |
| Previous Daily Low | 179.47 |
| Previous Weekly High | 184.02 |
| Previous Weekly Low | 182.02 |
| Previous Monthly High | 183.88 |
| Previous Monthly Low | 172.67 |
| Daily Fibonacci 38.2% | 180.27 |
| Daily Fibonacci 61.8% | 180.76 |
| Daily Pivot Point S1 | 179.05 |
| Daily Pivot Point S2 | 178.22 |
| Daily Pivot Point S3 | 176.96 |
| Daily Pivot Point R1 | 181.14 |
| Daily Pivot Point R2 | 182.39 |
| Daily Pivot Point R3 | 183.23 |
[/s2If]
Download Nehcap EAWe have two EAs that are operational on our LIVE accounts.
- EA-FIX: Check out the details here. Download EA-FIX . EA-FIX is a non-grid HFT scalper.
- EA-GROWTH: High quality low dd EA using trend grids. Download EA_GROWTHJoin Our Telegram Group
")


