The US inflation appears to be improving as the June Producer Price Index (PPI) fell short of expectations and previous month’s data. The Core PPI, which excludes volatile items, also displayed indications of softening.
…
This is a premium post.
[s2If !current_user_can(access_s2member_level4)]Please register for FREE REGISTER to read full post below containing analysis. In case of any error or you think you are not able to read the full post below, please email us at support#nehcap.com [lwa][/s2If] [s2If current_user_can(access_s2member_level1)]
- US inflation seems to be easing, with June’s Producer Price Index (PPI) missing estimates and the previous month’s data. The Core PPI, excluding volatile items, also showed signs of weakening.
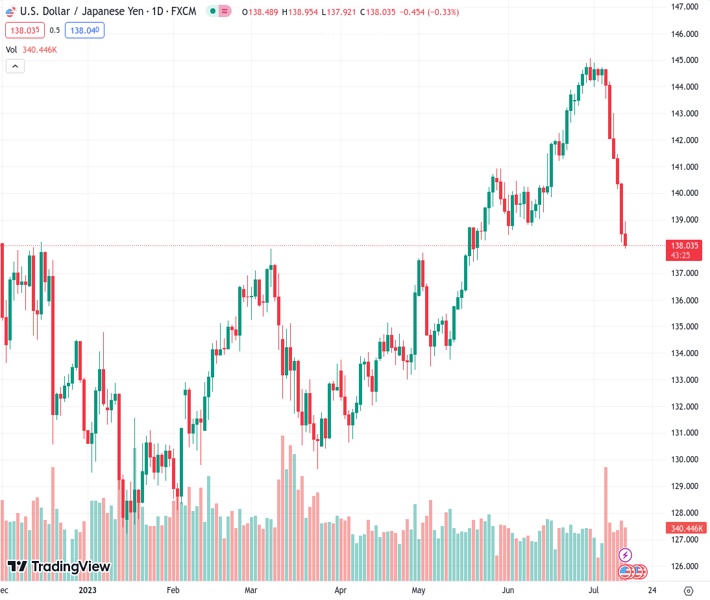
The pair currently trades last at 138.032.
The previous day high was 140.39 while the previous day low was 138.16. The daily 38.2% Fib levels comes at 139.01, expected to provide resistance. Similarly, the daily 61.8% fib level is at 139.54, expected to provide resistance.
The USD/JPY extended its losses for the sixth consecutive trading session and broke to a new two-month low of 137.92 on speculations the US Federal Reserve would hike in July to reach its peak rates as inflation continued to ease. Hence, the USD/JPY is trading at 137.98, below the psychological 138.00 figure, after hitting a daily high of 138.95.
Inflation in the United States (US) is edging lower after data revealed that the June Producer Price Index (PPI) missed estimates of the downside following Wednesday’s consumer inflation report. PPI expanded at a 0.1% YoY pace, beneath forecasts of 0.4%, and lower than May 1.1%, while Core PPI, which strips volatile items, showed signs of losing steam and expanded at a 2.4% YoY pace, below estimates of 2.6% and the previous month’s 2.8%.
Although the data would justify a pause on the Fed’s tightening cycle, money market futures think otherwise. According to the CME FedWatcth Tool, odds for a quarter of a percentage increase lie above 90%. Even though Fed Chair Jerome Powell and some of his colleagues expressed that “a couple” of increases are pending, investors pared those bets. That said, the Federal Funds Rate (FFR) is expected to peak at 5.25%-5.50% for the remainder of the year.
That would likely keep the greenback pressured, as shown by the US Dollar Index (DXY). The DXY, which tracks the buck’s performance against other currencies, tumbled to a new 15-month low of 99.741, losing 0.80%. Another factor weighed by lower inflation levels in the US is bond yields, with the US 10-year note rate sitting at 3.767%, down nine basis points.
Therefore, the USD/JPY has dropped 4% since July 6, mainly attributed to a soft US Dollar and lowes US bond yields.
On the Japanese front, households’ expectations for higher inflation levels put pressure on the Bank of Japan (BoJ). According to Reuters, “Households expect inflation to average 10.5% a year from now, the June survey showed, down from 11.1% in the previous survey but well above the BOJ’s 2% target.” That comes at the expense of BoJ Governor Kazuo Ueda’s stance to keep monetary policy loose until the BoJ sees clear evidence that inflation will persist at around 2%.
The USD/JPY has tumbled below the 100-day Exponential Moving Average (EMA) of 138.79, extending its downward path past the top of the Ichimoku Cloud. With USD/JPY prices dropping inside the Cloud suggests the trend is still strong. The Tenkan-Sen crossing below the Kijun-Sen, while the Chikou Span standing below the price action, means the USD/JPY shifted bearish and could threaten to edge lower. First support emerges at the 137.00 mark, followed by the 200-day EMA at 136.40. Conversely, if USD/JPY buyers reclaim 138.00, that could pave the way to regain the 100-day EMA, followed by the 139.00 figure.
Technical Levels: Supports and Resistances
USDJPY currently trading at 138.03 at the time of writing. Pair opened at 138.5 and is trading with a change of -0.34 % .
| Overview | Overview.1 | |
|---|---|---|
| 0 | Today last price | 138.03 |
| 1 | Today Daily Change | -0.47 |
| 2 | Today Daily Change % | -0.34 |
| 3 | Today daily open | 138.50 |
The pair is trading below its 20 Daily moving average @ 142.79, below its 50 Daily moving average @ 139.99 , above its 100 Daily moving average @ 136.96 and above its 200 Daily moving average @ 137.16
| Trends | Trends.1 | |
|---|---|---|
| 0 | Daily SMA20 | 142.79 |
| 1 | Daily SMA50 | 139.99 |
| 2 | Daily SMA100 | 136.96 |
| 3 | Daily SMA200 | 137.16 |
The previous day high was 140.39 while the previous day low was 138.16. The daily 38.2% Fib levels comes at 139.01, expected to provide resistance. Similarly, the daily 61.8% fib level is at 139.54, expected to provide resistance.
Note the levels of interest below:
- Pivot support is noted at 137.64, 136.78, 135.4
- Pivot resistance is noted at 139.88, 141.25, 142.11
| Levels | Levels.1 |
|---|---|
| Previous Daily High | 140.39 |
| Previous Daily Low | 138.16 |
| Previous Weekly High | 144.91 |
| Previous Weekly Low | 142.07 |
| Previous Monthly High | 145.07 |
| Previous Monthly Low | 138.43 |
| Daily Fibonacci 38.2% | 139.01 |
| Daily Fibonacci 61.8% | 139.54 |
| Daily Pivot Point S1 | 137.64 |
| Daily Pivot Point S2 | 136.78 |
| Daily Pivot Point S3 | 135.40 |
| Daily Pivot Point R1 | 139.88 |
| Daily Pivot Point R2 | 141.25 |
| Daily Pivot Point R3 | 142.11 |
[/s2If]
Download Nehcap EAWe have two EAs that are operational on our LIVE accounts.
- EA-FIX: Check out the details here. Download EA-FIX . EA-FIX is a non-grid HFT scalper.
- EA-GROWTH: High quality low dd EA using trend grids. Download EA_GROWTHJoin Our Telegram Group
")


