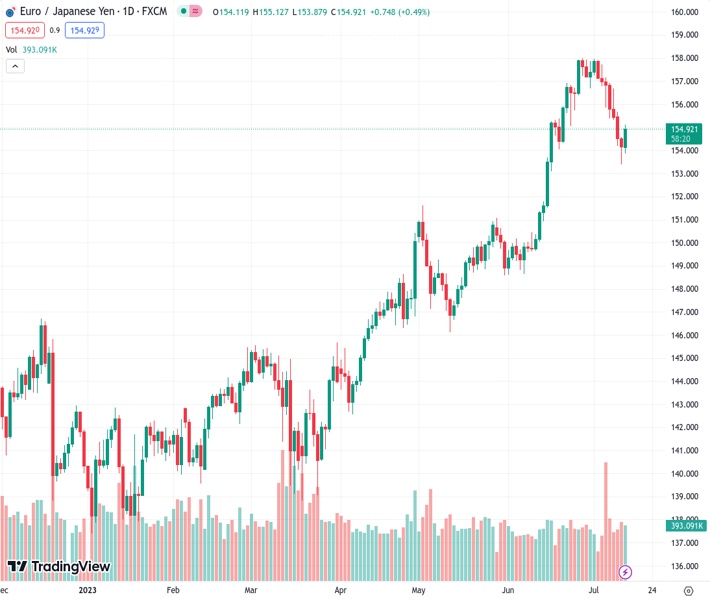
The bulls of #EURJPY at a price of 154.951 were able to recover after experiencing seven days of continuous losses and quickly rose to a level of 154.90.
…
This is a premium post.
[s2If !current_user_can(access_s2member_level4)]Please register for FREE REGISTER to read full post below containing analysis. In case of any error or you think you are not able to read the full post below, please email us at support#nehcap.com [lwa][/s2If] [s2If current_user_can(access_s2member_level1)]
- EUR/JPY’s bulls gained ground following seven consecutive days of losses and jumped to 154.90.
The pair currently trades last at 154.951.
The previous day high was 154.55 while the previous day low was 153.43. The daily 38.2% Fib levels comes at 153.86, expected to provide support. Similarly, the daily 61.8% fib level is at 154.12, expected to provide support.
On Thursday, the EUR/JPY managed to stop the bleeding following a seven-day losing streak and jumped towards the 154.90 area. The Euro gained traction following the release of the European’s Central Bank (ECB) accounts from the June meeting, and the Yen lost ground against most of its rivals amid weak Chinese Trade Balance data.
ECB’s monetary policy accounts showed that most of the Governing Council supported a 25 basis points (bps) hike in June and confirmed that a minimum of two additional increases were needed. In addition, the members “could consider” hiking beyond July if necessary. That being said, the ECB’s tightening expectations remain steady. World Interest Rate Probabilities (WIRP) suggests that a 25 basis points (bps) hike is already priced in for the July meeting, and additional hikes of a quarter of a percentage points rise to 60% and 80% in September and October, respectively. The markets foresee no more hikes following December.
During the early Asian trading hours, China released that its trade surplus rose to $70.62 billion from $65.81 billion in June. In addition, Imports and Exports declined by 6.8% and 12.4% YoY respectively in the same period. In that sense, the Bank of Japan (BoJ) should monitor its biggest trading partner situation as it could aggravate the local economic downturn.
In addition, Japan’s currency diplomat Masato Kanda cited that deflationary norms “may be changing” and that the BoJ is closely monitoring the FX markets. It’s worth noticing that the JPY had gained ground in the previous session thanks to expectations on a Yield Control Curve (YCC) policy tweak by the BoJ, so any hints of a pivot may contribute to limiting the Yen’s losses.
According to the daily chart, the EUR/JPY still holds a negative outlook for the short term. Indicators display weakness, with the Relative Strength Index (RSI) and Moving Average Convergence Divergence (MACD) standing in negative territory. However, on the bigger picture the outlook favour the Euro as it holds above the 100 and 200-day Simple Moving Averages (SMAs)
Support Levels: 153.40, 153.00, 152.50.
Resistance Levels: 155.40, 156.17 (20-day SMA), 157.00.
Technical Levels: Supports and Resistances
EURJPY currently trading at 154.88 at the time of writing. Pair opened at 154.12 and is trading with a change of 0.49 % .
| Overview | Overview.1 | |
|---|---|---|
| 0 | Today last price | 154.88 |
| 1 | Today Daily Change | 0.76 |
| 2 | Today Daily Change % | 0.49 |
| 3 | Today daily open | 154.12 |
The pair is trading below its 20 Daily moving average @ 156.18, above its 50 Daily moving average @ 152.05 , above its 100 Daily moving average @ 148.48 and above its 200 Daily moving average @ 145.78
| Trends | Trends.1 | |
|---|---|---|
| 0 | Daily SMA20 | 156.18 |
| 1 | Daily SMA50 | 152.05 |
| 2 | Daily SMA100 | 148.48 |
| 3 | Daily SMA200 | 145.78 |
The previous day high was 154.55 while the previous day low was 153.43. The daily 38.2% Fib levels comes at 153.86, expected to provide support. Similarly, the daily 61.8% fib level is at 154.12, expected to provide support.
Note the levels of interest below:
- Pivot support is noted at 153.51, 152.91, 152.4
- Pivot resistance is noted at 154.63, 155.15, 155.75
| Levels | Levels.1 |
|---|---|
| Previous Daily High | 154.55 |
| Previous Daily Low | 153.43 |
| Previous Weekly High | 157.96 |
| Previous Weekly Low | 155.38 |
| Previous Monthly High | 158.00 |
| Previous Monthly Low | 148.62 |
| Daily Fibonacci 38.2% | 153.86 |
| Daily Fibonacci 61.8% | 154.12 |
| Daily Pivot Point S1 | 153.51 |
| Daily Pivot Point S2 | 152.91 |
| Daily Pivot Point S3 | 152.40 |
| Daily Pivot Point R1 | 154.63 |
| Daily Pivot Point R2 | 155.15 |
| Daily Pivot Point R3 | 155.75 |
[/s2If]
Download Nehcap EAWe have two EAs that are operational on our LIVE accounts.
- EA-FIX: Check out the details here. Download EA-FIX . EA-FIX is a non-grid HFT scalper.
- EA-GROWTH: High quality low dd EA using trend grids. Download EA_GROWTHJoin Our Telegram Group
")


