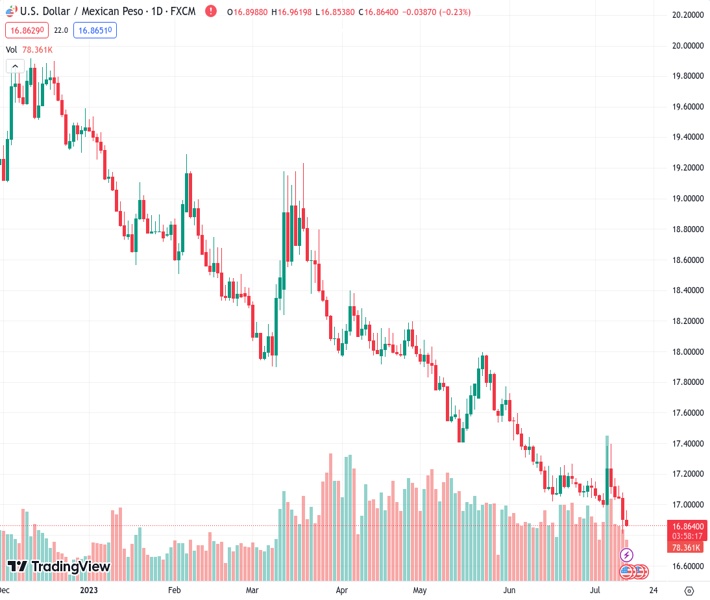
The US dollar to Mexican peso exchange rate bounces back a bit after reaching its lowest point in several years at 16.8083, but remains lower than the 17.0000 mark.
…
This is a premium post.
[s2If !current_user_can(access_s2member_level4)]Please register for FREE REGISTER to read full post below containing analysis. In case of any error or you think you are not able to read the full post below, please email us at support#nehcap.com [lwa][/s2If] [s2If current_user_can(access_s2member_level1)]
- USD/MXN recovers slightly after touching multi-year lows of 16.8083 but stays below the 17.0000 figure.
The pair currently trades last at 16.8620.
The previous day high was 17.0645 while the previous day low was 16.8085. The daily 38.2% Fib levels comes at 16.9063, expected to provide resistance. Similarly, the daily 61.8% fib level is at 16.9667, expected to provide resistance.
USD/MXN resumes its downtrend after touching muti-year lows of 16.8083, remains below the 17.0000 figure on Thursday after data from the United States (US) shows the Federal Reserve’s (Fed) job is about to be achieved, as inflation continues to edge lower. At the time of writing, the USD/MXN is trading at 16.8682 after hitting a daily high of 16.9619.
The USD/MXN drops due to improved risk appetite, to the detriment of safe-haven peers, like the US Dollar (USD). Data from the US Department of Labor (DoL) revealed that Initial Jobless Claims for the last week climbed less than estimates of 250K, standing at 237K. The Fed’s Beige Book showed that demand for labor “remained healthy” in June, though it noted that hiring “was getting more targeted and selective.”
At the same time, the US Producer Price Index (PPI) for June expanded by 0.1% MoM, exceeding May’s 0.4% plunge but was beneath estimates of 0.2%. On year-over-year (YoY) figures, PPI grew 0.1%, below forecasts of 0.4%, while the Core PPI, which excludes volatile items, increased 0.1% MoM, unchanged from May, accelerating below estimates of 0.2%. Yearly Core PPI cooled down compared to expectations of 2.6% and came at 2.4%. Hence PPI data followed suit with a soft US CPI report that could refrain Fed officials from lifting rates twice, as they previously commented after the FOMC’s June meeting.
An absent Mexican economic docket leaves USD/MXN traders focused on the US dynamics. As long as the interest rate differential between the US and Mexico favors the latter, further downside is expected. However, traders must know that political risks are beginning to boil in Mexico as general elections loom for June 2024.
The USD/MXN downtrend would likely continue as the pair remains below the 17.00 mark. Sellers eyeing the October 2015 swing low of 16.3267 keeps the USD/MXN pressured, with the next support eyed at 16.5000 before sellers reclaim the latter. The following support would emerge at 16.00. Conversely, if USD/MXN buyers regain the 17.0000 figure, it could exacerbate a recovery toward the 20-day Exponential Moving Average (EMA) at 17.1073 short term. The USD/MXN must surpass the 17.4038 area to switch the bias to neutral.
Technical Levels: Supports and Resistances
USDMXN currently trading at 16.8878 at the time of writing. Pair opened at 16.902 and is trading with a change of -0.08 % .
| Overview | Overview.1 | |
|---|---|---|
| 0 | Today last price | 16.8878 |
| 1 | Today Daily Change | -0.0142 |
| 2 | Today Daily Change % | -0.0800 |
| 3 | Today daily open | 16.9020 |
The pair remains strongly bearish on the daily time frame. It trades below the 20 SMA @ 17.1012, 50 SMA 17.3945, 100 SMA @ 17.8178 and 200 SMA @ 18.5794.
| Trends | Trends.1 | |
|---|---|---|
| 0 | Daily SMA20 | 17.1012 |
| 1 | Daily SMA50 | 17.3945 |
| 2 | Daily SMA100 | 17.8178 |
| 3 | Daily SMA200 | 18.5794 |
The previous day high was 17.0645 while the previous day low was 16.8085. The daily 38.2% Fib levels comes at 16.9063, expected to provide resistance. Similarly, the daily 61.8% fib level is at 16.9667, expected to provide resistance.
Note the levels of interest below:
- Pivot support is noted at 16.7855, 16.669, 16.5295
- Pivot resistance is noted at 17.0415, 17.181, 17.2975
| Levels | Levels.1 |
|---|---|
| Previous Daily High | 17.0645 |
| Previous Daily Low | 16.8085 |
| Previous Weekly High | 17.3957 |
| Previous Weekly Low | 16.9803 |
| Previous Monthly High | 17.7286 |
| Previous Monthly Low | 17.0243 |
| Daily Fibonacci 38.2% | 16.9063 |
| Daily Fibonacci 61.8% | 16.9667 |
| Daily Pivot Point S1 | 16.7855 |
| Daily Pivot Point S2 | 16.6690 |
| Daily Pivot Point S3 | 16.5295 |
| Daily Pivot Point R1 | 17.0415 |
| Daily Pivot Point R2 | 17.1810 |
| Daily Pivot Point R3 | 17.2975 |
[/s2If]
Download Nehcap EAWe have two EAs that are operational on our LIVE accounts.
- EA-FIX: Check out the details here. Download EA-FIX . EA-FIX is a non-grid HFT scalper.
- EA-GROWTH: High quality low dd EA using trend grids. Download EA_GROWTHJoin Our Telegram Group
")


