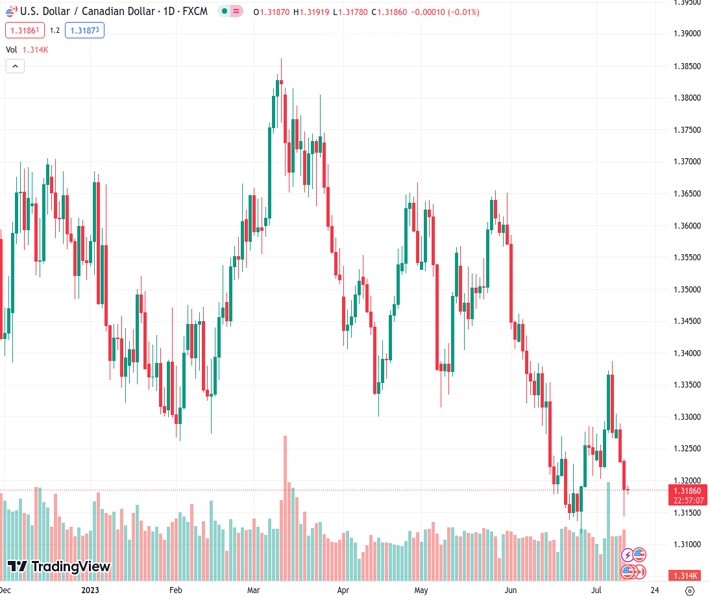
The USDCAD pair dropped to a minimum of 1.3145 before stabilizing at 1.3185, ultimately concluding with a decline in value.
…
This is a premium post.
[s2If !current_user_can(access_s2member_level4)]Please register for FREE REGISTER to read full post below containing analysis. In case of any error or you think you are not able to read the full post below, please email us at support#nehcap.com [lwa][/s2If] [s2If current_user_can(access_s2member_level1)]
- The USD/CAD fell to a low of 1.3145 and then settled at 1.3185, closing with losses.
The pair currently trades last at 1.31851.
The previous day high was 1.329 while the previous day low was 1.323. The daily 38.2% Fib levels comes at 1.3253, expected to provide resistance. Similarly, the daily 61.8% fib level is at 1.3267, expected to provide resistance.
The Lonnie traded with strong gains agains the USD on Wednesday following the Bank of Canada’s announcement of a 25 basis points hike and soft inflation figures from the US. However, the CAD traded weak agains most of its rivals, including the AUD, JPY, EUR and GBP.
The Bank of Canada (BoC) announced that it raised interest rates by 25 basis points (bps) to 5%, as expected. Regarding the statement, in summary, the bank expects inflation to decline gradually but at a slower pace than previously anticipated and stated that economic activity is forecasted to slow down in the near term, despite a recent pickup in growth. Looking forward, the BoC confirmed that they will keep an eye on evidence of excess demand and sticky core and wage inflation to determine their next monetary policy decisions.
On the US’s side, the Bureau of Labor Statistics reported soft inflation figures from June, which triggered a sharp decline in US Treasury yields. The headline US Consumer Price Index (CPI) fell to 3% YoY, while the Core CPI to 4.8% YoY, both falling short of expectations. In addition, the Federal Reserve (Fed) released its Beige Book report, which stated that the US economic activity has slightly increased since late May. However, the USD held its daily losses due to soft inflation figures, and DXY Index fell to the 100.55 zone, its lowest since April 2022.
The pair’s outlook for the short term is bearish as the USD/CAD now trades below its main Simple Moving Averages (SMAs) of 20, 100 and 200-days. In addition, technical indicators show weakness as the Relative Strength Index (RSI) stands deep in negative territory and the Moving Average Convergence Divergence (MACD), which prints rising red bars.
Support Levels: 1.3145, 1.3139, 1.3115.
Resistance Levels: 1.3200, 1.3225 (20-day SMA), 1.3275.
Technical Levels: Supports and Resistances
USDCAD currently trading at 1.3188 at the time of writing. Pair opened at 1.323 and is trading with a change of -0.32 % .
| Overview | Overview.1 | |
|---|---|---|
| 0 | Today last price | 1.3188 |
| 1 | Today Daily Change | -0.0042 |
| 2 | Today Daily Change % | -0.3200 |
| 3 | Today daily open | 1.3230 |
The pair remains strongly bearish on the daily time frame. It trades below the 20 SMA @ 1.3235, 50 SMA 1.3378, 100 SMA @ 1.3484 and 200 SMA @ 1.35.
| Trends | Trends.1 | |
|---|---|---|
| 0 | Daily SMA20 | 1.3235 |
| 1 | Daily SMA50 | 1.3378 |
| 2 | Daily SMA100 | 1.3484 |
| 3 | Daily SMA200 | 1.3500 |
The previous day high was 1.329 while the previous day low was 1.323. The daily 38.2% Fib levels comes at 1.3253, expected to provide resistance. Similarly, the daily 61.8% fib level is at 1.3267, expected to provide resistance.
Note the levels of interest below:
- Pivot support is noted at 1.3211, 1.3191, 1.3151
- Pivot resistance is noted at 1.327, 1.3309, 1.3329
| Levels | Levels.1 |
|---|---|
| Previous Daily High | 1.3290 |
| Previous Daily Low | 1.3230 |
| Previous Weekly High | 1.3387 |
| Previous Weekly Low | 1.3203 |
| Previous Monthly High | 1.3585 |
| Previous Monthly Low | 1.3117 |
| Daily Fibonacci 38.2% | 1.3253 |
| Daily Fibonacci 61.8% | 1.3267 |
| Daily Pivot Point S1 | 1.3211 |
| Daily Pivot Point S2 | 1.3191 |
| Daily Pivot Point S3 | 1.3151 |
| Daily Pivot Point R1 | 1.3270 |
| Daily Pivot Point R2 | 1.3309 |
| Daily Pivot Point R3 | 1.3329 |
[/s2If]
Download Nehcap EAWe have two EAs that are operational on our LIVE accounts.
- EA-FIX: Check out the details here. Download EA-FIX . EA-FIX is a non-grid HFT scalper.
- EA-GROWTH: High quality low dd EA using trend grids. Download EA_GROWTHJoin Our Telegram Group
")


