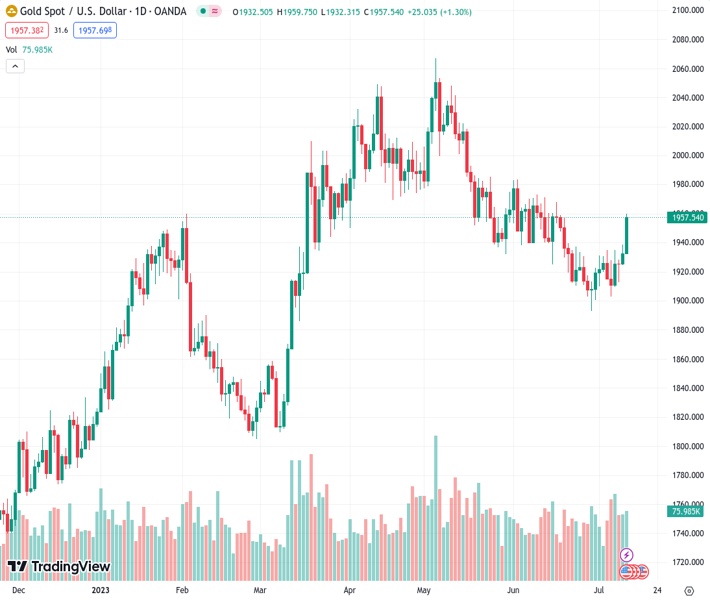
The XAUUSD, which is currently at a price of 1,957.06, has surpassed the 100-day Simple Moving Average and is now at $1,958.
…
This is a premium post.
[s2If !current_user_can(access_s2member_level4)]Please register for FREE REGISTER to read full post below containing analysis. In case of any error or you think you are not able to read the full post below, please email us at support#nehcap.com [lwa][/s2If] [s2If current_user_can(access_s2member_level1)]
- XAU/USD jumped above the 100-day SMA to $1,958
The pair currently trades last at 1957.06.
The previous day high was 1938.54 while the previous day low was 1924.44. The daily 38.2% Fib levels comes at 1933.15, expected to provide support. Similarly, the daily 61.8% fib level is at 1929.83, expected to provide support.
On Wednesday, the Gold spot XAU/USD gained more than 1% and jumped to a daily high of $1,958. In that sense, the yellow metal gained ground following the report of soft inflation figures from the US, which fueled a decline in US yields. In the meantime, the DXY index stands at its lowest level since April 2022, and the Federal Reserve Beige Book report failed to trigger a recovery.
According to the US Bureau of Labor Statistics, the US Consumer Price Index (CPI) fell to 3% year-on-year in June, slightly lower than the expected 3.1% and down from the previous figure of 4%. The Core inflation also decreased to 4.8% year-on-year, below the anticipated 5% from the previous 5.3%. Consequently, US Treasury yields experienced significant declines across the board. The 2-year yield dropped to 4.74%, the 5-year yield fell to 4.07%, and the 10-year yield dived to 3.86% all three seeing more than 2% declines on the day.
Despite falling yields, investors continue to bet on a 25 basis points hike in the next July meeting, according to the CME FedWatch tool. That said, investors shouldn’t take off the table another hike for the rest of 2023 as Jerome Powell and several Federal Reserve (Fed) officials hinted that “multiple hikes” may be appropriate.
In addition, the Federal Reserve’s Beige Book revealed that the overall economic activity in the US has seen a slight increase since late May. The report also indicated that consumer spending had shown mixed results, with growth primarily observed in consumer services. However, following the report’s release, its impact on the USD was limited as it continues to show weakness agains most of its rivals.
After piercing through the 100-day Simple Moving Average, the XAU/USD confirms a bullish outlook for the short term, as it now trades above the 20, 100 and 200-day SMAs. In addition, indicators show strength with the Relative Strength Index (RSI) pointing north above its midline while the Moving Average Convergence Divergence (MACD) prints higher green bars.
Resistance levels: $1,970, $1,980, $2,000.
Support levels: 1,950 (100-day SMA), $1,930 (20-day SMA), $1,915.
Technical Levels: Supports and Resistances
XAUUSD currently trading at 1958.77 at the time of writing. Pair opened at 1932.26 and is trading with a change of 1.37 % .
| Overview | Overview.1 | |
|---|---|---|
| 0 | Today last price | 1958.77 |
| 1 | Today Daily Change | 26.51 |
| 2 | Today Daily Change % | 1.37 |
| 3 | Today daily open | 1932.26 |
The pair is trading above its 20 Daily moving average @ 1927.0, below its 50 Daily moving average @ 1959.16 , above its 100 Daily moving average @ 1949.73 and above its 200 Daily moving average @ 1868.82
| Trends | Trends.1 | |
|---|---|---|
| 0 | Daily SMA20 | 1927.00 |
| 1 | Daily SMA50 | 1959.16 |
| 2 | Daily SMA100 | 1949.73 |
| 3 | Daily SMA200 | 1868.82 |
The previous day high was 1938.54 while the previous day low was 1924.44. The daily 38.2% Fib levels comes at 1933.15, expected to provide support. Similarly, the daily 61.8% fib level is at 1929.83, expected to provide support.
Note the levels of interest below:
- Pivot support is noted at 1924.95, 1917.65, 1910.85
- Pivot resistance is noted at 1939.05, 1945.85, 1953.15
| Levels | Levels.1 |
|---|---|
| Previous Daily High | 1938.54 |
| Previous Daily Low | 1924.44 |
| Previous Weekly High | 1935.09 |
| Previous Weekly Low | 1902.77 |
| Previous Monthly High | 1983.50 |
| Previous Monthly Low | 1893.01 |
| Daily Fibonacci 38.2% | 1933.15 |
| Daily Fibonacci 61.8% | 1929.83 |
| Daily Pivot Point S1 | 1924.95 |
| Daily Pivot Point S2 | 1917.65 |
| Daily Pivot Point S3 | 1910.85 |
| Daily Pivot Point R1 | 1939.05 |
| Daily Pivot Point R2 | 1945.85 |
| Daily Pivot Point R3 | 1953.15 |
[/s2If]
Download Nehcap EAWe have two EAs that are operational on our LIVE accounts.
- EA-FIX: Check out the details here. Download EA-FIX . EA-FIX is a non-grid HFT scalper.
- EA-GROWTH: High quality low dd EA using trend grids. Download EA_GROWTHJoin Our Telegram Group
")


