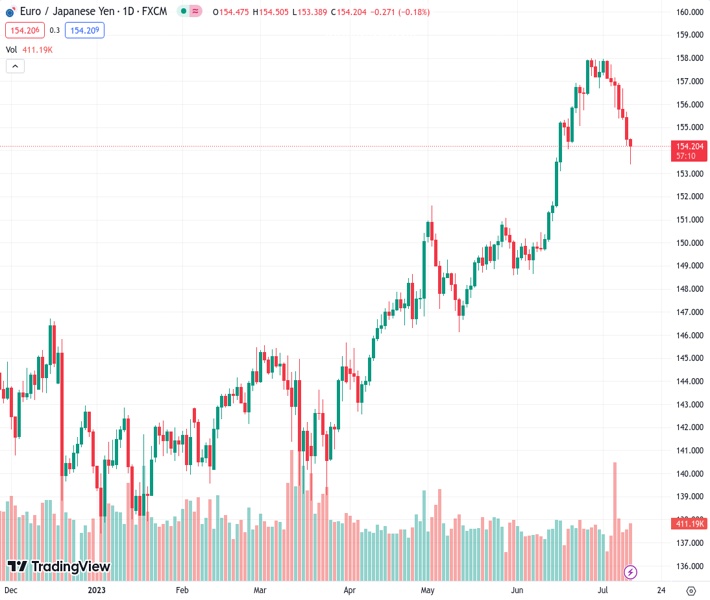
The EURJPY currency pair, currently at 154.201, has experienced a period of seven consecutive days of losses. It has now dropped to a level close to 153.40, which it hasn’t reached since the middle of June.
…
This is a premium post.
[s2If !current_user_can(access_s2member_level4)]Please register for FREE REGISTER to read full post below containing analysis. In case of any error or you think you are not able to read the full post below, please email us at support#nehcap.com [lwa][/s2If] [s2If current_user_can(access_s2member_level1)]
- The EUR/JPY records a seven-day losing streak and fell to a low near 153.40 for the first time since mid-June.
The pair currently trades last at 154.201.
The previous day high was 155.67 while the previous day low was 154.18. The daily 38.2% Fib levels comes at 154.75, expected to provide resistance. Similarly, the daily 61.8% fib level is at 155.1, expected to provide resistance.
In Wednesday’s session, the JPY gained further ground agains the EUR and managed to hold gains despite weak economic data reported during the Asian session. Despite inventors continue to bet on a liftoff by the Bank of Japan, analyst at Rabobank think otherwise.
The Cabinet Office reported that Machinery Orders dropped 7.6% in May MoM, far above the 1% decline expected, and recorded a yearly decrease of 8.7%. In addition, the Statistics Bureau reported that Produce Price Inflation (PPI) decline to 4.1% in June, below the 4.3% expected, from the previous 5.2% figure.
Investors shouldn’t be so confident about a potential BoJ monetary policy pivot as the economy is softening. That being said, analysts at Rabobank stated that concerns about the global economy outlook amid the tight monetary policy of the US suggest the BoJ’s possibility of a pivot is likely to be “narrow” and “non-existent”. In addition, China’s economic situation should be closely watched because it is showing weakness and may contribute to the downturn of Japan’s economic activity. In that sense, Thursday’s Trade Balance data from China from June will be closely watched as it can fuel volatility in the JPY’s price dynamics.
On the Euro’s side, its economic calendar had non-high-tier data released. Spain confirmed its Consumer Price Index declined below 2% to 1.9% YoY in June. Regarding the European Central Bank’s (ECB) next movements, a 25 basis points (bps) hike is already priced in July, and investors bet on high probabilities of additional increases in September and October. In that sense, hawkish bets on the ECB may limit the Euro’s losses.
According to the daily chart, the bears are clearly in command, and oversold conditions are already seen in the 4-hour chart. That being said, after seven days of losses, an upwards technical correction should be taken of the table as bears may start to lose some traction. Meanwhile, the Relative Strength Index (RSI) points south in negative territory, while the Moving Average Convergence Divergence (MACD) stands with higher red bars.
Support Levels: 153.40, 153.00, 152.50.
Resistance Levels: 155.40, 156.11 (20-day SMA), 157.00.
Technical Levels: Supports and Resistances
EURJPY currently trading at 154.11 at the time of writing. Pair opened at 154.54 and is trading with a change of -0.28 % .
| Overview | Overview.1 | |
|---|---|---|
| 0 | Today last price | 154.11 |
| 1 | Today Daily Change | -0.43 |
| 2 | Today Daily Change % | -0.28 |
| 3 | Today daily open | 154.54 |
The pair is trading below its 20 Daily moving average @ 156.06, above its 50 Daily moving average @ 151.95 , above its 100 Daily moving average @ 148.37 and above its 200 Daily moving average @ 145.73
| Trends | Trends.1 | |
|---|---|---|
| 0 | Daily SMA20 | 156.06 |
| 1 | Daily SMA50 | 151.95 |
| 2 | Daily SMA100 | 148.37 |
| 3 | Daily SMA200 | 145.73 |
The previous day high was 155.67 while the previous day low was 154.18. The daily 38.2% Fib levels comes at 154.75, expected to provide resistance. Similarly, the daily 61.8% fib level is at 155.1, expected to provide resistance.
Note the levels of interest below:
- Pivot support is noted at 153.92, 153.31, 152.43
- Pivot resistance is noted at 155.41, 156.29, 156.9
| Levels | Levels.1 |
|---|---|
| Previous Daily High | 155.67 |
| Previous Daily Low | 154.18 |
| Previous Weekly High | 157.96 |
| Previous Weekly Low | 155.38 |
| Previous Monthly High | 158.00 |
| Previous Monthly Low | 148.62 |
| Daily Fibonacci 38.2% | 154.75 |
| Daily Fibonacci 61.8% | 155.10 |
| Daily Pivot Point S1 | 153.92 |
| Daily Pivot Point S2 | 153.31 |
| Daily Pivot Point S3 | 152.43 |
| Daily Pivot Point R1 | 155.41 |
| Daily Pivot Point R2 | 156.29 |
| Daily Pivot Point R3 | 156.90 |
[/s2If]
Download Nehcap EAWe have two EAs that are operational on our LIVE accounts.
- EA-FIX: Check out the details here. Download EA-FIX . EA-FIX is a non-grid HFT scalper.
- EA-GROWTH: High quality low dd EA using trend grids. Download EA_GROWTHJoin Our Telegram Group
")


