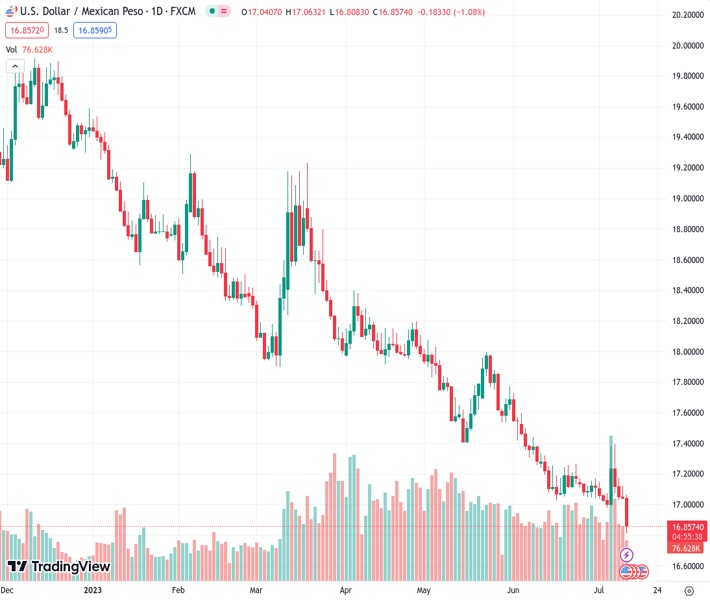
The US dollar to Mexican peso exchange rate, currently at 16.8506, has dropped below 17.0000 as a result of weaker US inflation data, causing a decrease in expectations for additional interest rate increases. Conversely, the Mexican peso has been strengthened by positive Industrial Production results in Mexico.
…
This is a premium post.
[s2If !current_user_can(access_s2member_level4)]Please register for FREE REGISTER to read full post below containing analysis. In case of any error or you think you are not able to read the full post below, please email us at support#nehcap.com [lwa][/s2If] [s2If current_user_can(access_s2member_level1)]
- USD/MXN plunges below 17.0000 as softer US inflation data reduces expectations of further rate hikes, while upbeat Industrial Production in Mexico boosts MXN.
The pair currently trades last at 16.8506.
The previous day high was 17.1219 while the previous day low was 17.0422. The daily 38.2% Fib levels comes at 17.0727, expected to provide resistance. Similarly, the daily 61.8% fib level is at 17.0915, expected to provide resistance.
USD/MXN plummets below the 17.0000 figure as a softer-than-expected inflation report in the United States (US) has traders paring bets of further rate hikes. Also, upbeat Industrial Production (IP) data in Mexico was cheered by Mexican Peso (MXN) bulls. The USD/MXN is trading at multi-year lows, exchanging hands at 16.8386 after printing a daily high of 17.0632, with more than 1% losses.
The US Department of Labor (DoL) showed inflation is decelerating at a higher pace, as the June Consumer Price Index (CPI) report revealed. CPI came at 3.0%, below estimates of 3.1%. Excluding volatile items like food and energy, the so-called core CPI rose by 4.8% YoY, beneath forecasts of 5.0%, and lower than May’s 5.3%. Data eases pressure on the US Federal Reserve (Fed) to continue tightening monetary policy aggressively, as most speakers throughout the week stressed the need for two rate increases. Nevertheless, traders pared November’s meeting chances for a quarter of a percentage rate hike, with odds dropping from 38.2% to 25% after the CPI report, as shown by the CME FedWatch Tool.
The central bank bonanza continued with Minnesota and Richmond’s Fed Presidents Neil Kashkari and Thomas Barkin crossing the wires. Thomas Barkin said that inflation is too high and emphasized he’s comfortable doing more to tackle inflation, while Kashkari noted that the inflation fight must be won and that if inflation gets higher, rates must be raised further.
The greenback plunges across the board, with the US Dollar Index down 0.94%, at 100.703, at its lowest level since April 2022, weighed by falling US Treasury bond yields, which are nosediving.
On the Mexican front, Industrial Production rose 1% in May from April. It was above estimates of a 1.9% expansion on yearly figures. It came at 3.9%, flashing a robust economy benefiting from a possible nearshoring, which has failed to gain more pace, as investors eye the 2024 general election.
From a technical perspective, the USD/MXN is set to continue to weaken as price action continues to show the Mexican Peso (MXN) strength, with traders eyeing the October 2015 swing low of 16.3267. Still, speculators will face solid support at 16.5000. Although the Relative Strength Index (RSI) shows the indicator approaching oversold conditions, it still warrants further USD/MXN downside. Contrarily, if USD/MXN buyers enter the market, they must reclaim the 17.0000 mark to have the opportunity to shift the pair’s bias to neutral.
Technical Levels: Supports and Resistances
USDMXN currently trading at 16.8367 at the time of writing. Pair opened at 17.043 and is trading with a change of -1.21 % .
| Overview | Overview.1 | |
|---|---|---|
| 0 | Today last price | 16.8367 |
| 1 | Today Daily Change | -0.2063 |
| 2 | Today Daily Change % | -1.2100 |
| 3 | Today daily open | 17.0430 |
The pair remains strongly bearish on the daily time frame. It trades below the 20 SMA @ 17.1114, 50 SMA 17.4151, 100 SMA @ 17.8325 and 200 SMA @ 18.5953.
| Trends | Trends.1 | |
|---|---|---|
| 0 | Daily SMA20 | 17.1114 |
| 1 | Daily SMA50 | 17.4151 |
| 2 | Daily SMA100 | 17.8325 |
| 3 | Daily SMA200 | 18.5953 |
The previous day high was 17.1219 while the previous day low was 17.0422. The daily 38.2% Fib levels comes at 17.0727, expected to provide resistance. Similarly, the daily 61.8% fib level is at 17.0915, expected to provide resistance.
Note the levels of interest below:
- Pivot support is noted at 17.0162, 16.9894, 16.9366
- Pivot resistance is noted at 17.0959, 17.1487, 17.1756
| Levels | Levels.1 |
|---|---|
| Previous Daily High | 17.1219 |
| Previous Daily Low | 17.0422 |
| Previous Weekly High | 17.3957 |
| Previous Weekly Low | 16.9803 |
| Previous Monthly High | 17.7286 |
| Previous Monthly Low | 17.0243 |
| Daily Fibonacci 38.2% | 17.0727 |
| Daily Fibonacci 61.8% | 17.0915 |
| Daily Pivot Point S1 | 17.0162 |
| Daily Pivot Point S2 | 16.9894 |
| Daily Pivot Point S3 | 16.9366 |
| Daily Pivot Point R1 | 17.0959 |
| Daily Pivot Point R2 | 17.1487 |
| Daily Pivot Point R3 | 17.1756 |
[/s2If]
Download Nehcap EAWe have two EAs that are operational on our LIVE accounts.
- EA-FIX: Check out the details here. Download EA-FIX . EA-FIX is a non-grid HFT scalper.
- EA-GROWTH: High quality low dd EA using trend grids. Download EA_GROWTHJoin Our Telegram Group
")


