The US annual CPI weakened to 3%, marking the lowest figure seen since March 2021.
…
This is a premium post.
[s2If !current_user_can(access_s2member_level4)]Please register for FREE REGISTER to read full post below containing analysis. In case of any error or you think you are not able to read the full post below, please email us at support#nehcap.com [lwa][/s2If] [s2If current_user_can(access_s2member_level1)]
- US annual CPI slowed to 3%, the lowest reading since March 2021.
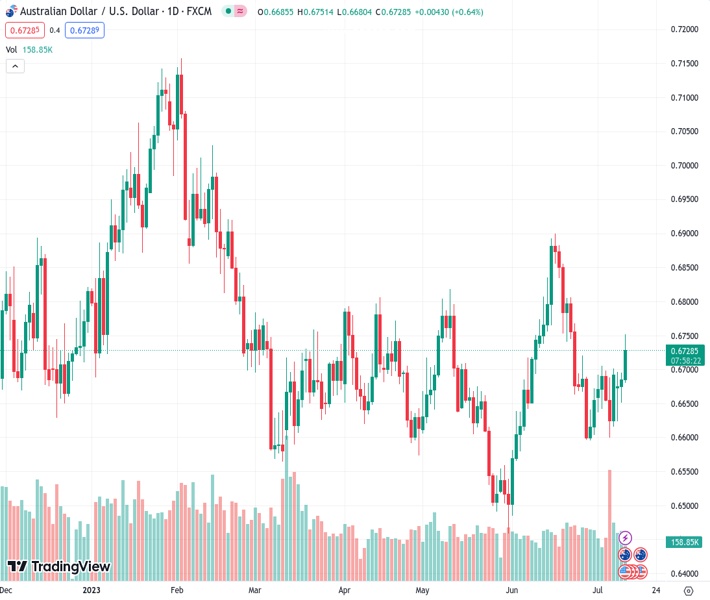
The pair currently trades last at 0.67293.
The previous day high was 0.6695 while the previous day low was 0.6651. The daily 38.2% Fib levels comes at 0.6678, expected to provide support. Similarly, the daily 61.8% fib level is at 0.6668, expected to provide support.
After the release of the US consumer inflation data, which came in below expectations, the AUD/USD pair surged from 0.6685 to 0.6752, reaching its highest level since June 23. The pair remains near the highs as markets digest the new data.
The US Consumer Price Index (CPI) increased 0.2% in June, below the expected 0.3%. The annual rate fell from 4% to 3%, which is below the market consensus of 3.1%, and the lowest since March 2021. The annual Core rate also fell from 5.3% in May to 4.8% in June, which is below the estimated 5%.
As a result of the lower-than-expected US CPI figures, markets have priced in lower odds of a second rate hike from the Fed this year. However, a rate hike in the July meeting is almost fully priced in.
Following the release of the US CPI figures, US Treasury yields tumbled, with the US 10-year dropping from 3.95% to 3.88%, and the 2-year from 4.84% to 4.73%. The US Dollar Index (DXY) also fell to test June lows, trading near 101.00. Wall Street futures rose, and commodity prices jumped. The current context favors the upside in AUD/USD, with increased risk appetite and lower US yields.
The 0.6750 area represents immediate resistance for the pair, and consolidation above it could open the doors to more gains. The next resistance stands at 0.6765, followed by a strong barrier at 0.6800. The 0.6700/05 area is the immediate support and while above, risks are tilted towards the upside.
Technical Levels: Supports and Resistances
AUDUSD currently trading at 0.669 at the time of writing. Pair opened at 0.6687 and is trading with a change of 0.04 % .
| Overview | Overview.1 | |
|---|---|---|
| 0 | Today last price | 0.6690 |
| 1 | Today Daily Change | 0.0003 |
| 2 | Today Daily Change % | 0.0400 |
| 3 | Today daily open | 0.6687 |
The pair is trading below its 20 Daily moving average @ 0.6718, above its 50 Daily moving average @ 0.6678 , above its 100 Daily moving average @ 0.6683 and below its 200 Daily moving average @ 0.6699
| Trends | Trends.1 | |
|---|---|---|
| 0 | Daily SMA20 | 0.6718 |
| 1 | Daily SMA50 | 0.6678 |
| 2 | Daily SMA100 | 0.6683 |
| 3 | Daily SMA200 | 0.6699 |
The previous day high was 0.6695 while the previous day low was 0.6651. The daily 38.2% Fib levels comes at 0.6678, expected to provide support. Similarly, the daily 61.8% fib level is at 0.6668, expected to provide support.
Note the levels of interest below:
- Pivot support is noted at 0.666, 0.6633, 0.6616
- Pivot resistance is noted at 0.6704, 0.6722, 0.6748
| Levels | Levels.1 |
|---|---|
| Previous Daily High | 0.6695 |
| Previous Daily Low | 0.6651 |
| Previous Weekly High | 0.6705 |
| Previous Weekly Low | 0.6599 |
| Previous Monthly High | 0.6900 |
| Previous Monthly Low | 0.6484 |
| Daily Fibonacci 38.2% | 0.6678 |
| Daily Fibonacci 61.8% | 0.6668 |
| Daily Pivot Point S1 | 0.6660 |
| Daily Pivot Point S2 | 0.6633 |
| Daily Pivot Point S3 | 0.6616 |
| Daily Pivot Point R1 | 0.6704 |
| Daily Pivot Point R2 | 0.6722 |
| Daily Pivot Point R3 | 0.6748 |
[/s2If]
Download Nehcap EAWe have two EAs that are operational on our LIVE accounts.
- EA-FIX: Check out the details here. Download EA-FIX . EA-FIX is a non-grid HFT scalper.
- EA-GROWTH: High quality low dd EA using trend grids. Download EA_GROWTHJoin Our Telegram Group
")


