#USDCHF @ 0.87839 drifts lower for the fifth straight day and drops to a 2-1/2 year trough on Wednesday.
…
This is a premium post.
[s2If !current_user_can(access_s2member_level4)]Please register for FREE REGISTER to read full post below containing analysis. In case of any error or you think you are not able to read the full post below, please email us at support#nehcap.com [lwa][/s2If] [s2If current_user_can(access_s2member_level1)]
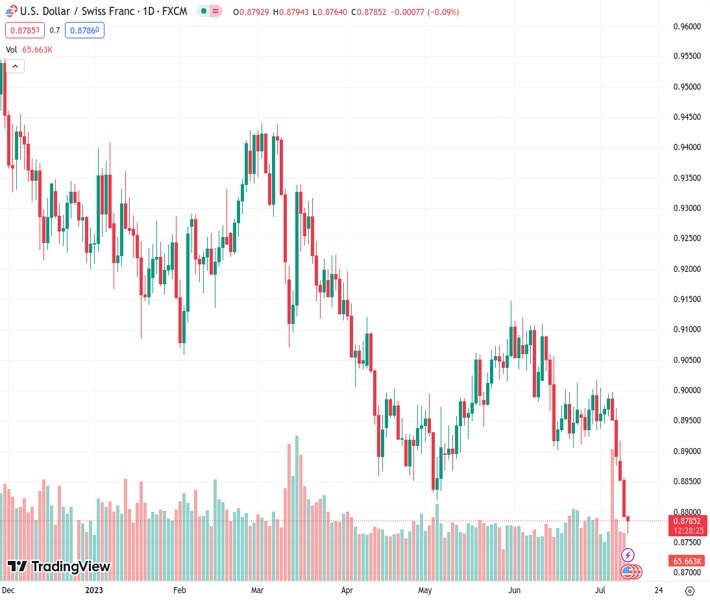
- USD/CHF drifts lower for the fifth straight day and drops to a 2-1/2 year trough on Wednesday.
The pair currently trades last at 0.87839.
The previous day high was 0.8868 while the previous day low was 0.8793. The daily 38.2% Fib levels comes at 0.8822, expected to provide resistance. Similarly, the daily 61.8% fib level is at 0.884, expected to provide resistance.
The USD/CHF pair remains under some selling pressure for the fifth successive day on Wednesday and drops to its lowest level since January 2021 during the early European session. Spot prices, however, manage to recover a few pips in the last hour and currently trade around the 0.8780-0.8785 region, down only 0.10% for the day.
The recent US Dollar (USD) downtrend witnessed over the past week or so, to a two-month low, remains uninterrupted in the wake of speculations that the Federal Reserve (Fed) is nearly done with its policy tightening. Investors now seem convinced that the US central bank will end its rate-hiking cycle following the expected lift-off in July, which is reinforced by the ongoing retracement slide in the US Treasury bond yields. This, in turn, is seen weighing on the USD and turning out to be a key factor dragging the USD/CHF pair lower.
The closely-watched US employment details released on Friday showed that the economy added the fewest jobs in 2-1/2 years in June and indicated that the labor market is cooling. Furthermore. the New York Fed’s monthly survey revealed on Monday that the one-year consumer inflation expectation dropped to 3.8% in June – the lowest level since April 2021. This, in turn, fueled speculations about a further deceleration in US consumer inflation, which should allow the US central bank to soften its hawkish stance sooner rather than later.
Hence, the market focus remains glued to the release of the latest US consumer inflation figures, due later during the early North American session. Heading into the key data risk, a modest recovery in the global risk sentiment – as depicted by a generally positive tone around the equity markets – undermines the safe-haven Swiss Franc (CHF) and helps limit losses for the USD/CHF pair, at least for the time being. The fundamental backdrop, however, favours bearish traders and suggests that the path of least resistance for spot prices is to the downside.
Technical Levels: Supports and Resistances
USDCHF currently trading at 0.8785 at the time of writing. Pair opened at 0.8794 and is trading with a change of -0.1 % .
| Overview | Overview.1 | |
|---|---|---|
| 0 | Today last price | 0.8785 |
| 1 | Today Daily Change | -0.0009 |
| 2 | Today Daily Change % | -0.1000 |
| 3 | Today daily open | 0.8794 |
The pair remains strongly bearish on the daily time frame. It trades below the 20 SMA @ 0.8944, 50 SMA 0.8979, 100 SMA @ 0.9062 and 200 SMA @ 0.9272.
| Trends | Trends.1 | |
|---|---|---|
| 0 | Daily SMA20 | 0.8944 |
| 1 | Daily SMA50 | 0.8979 |
| 2 | Daily SMA100 | 0.9062 |
| 3 | Daily SMA200 | 0.9272 |
The previous day high was 0.8868 while the previous day low was 0.8793. The daily 38.2% Fib levels comes at 0.8822, expected to provide resistance. Similarly, the daily 61.8% fib level is at 0.884, expected to provide resistance.
Note the levels of interest below:
- Pivot support is noted at 0.8769, 0.8744, 0.8694
- Pivot resistance is noted at 0.8844, 0.8893, 0.8918
| Levels | Levels.1 |
|---|---|
| Previous Daily High | 0.8868 |
| Previous Daily Low | 0.8793 |
| Previous Weekly High | 0.9005 |
| Previous Weekly Low | 0.8876 |
| Previous Monthly High | 0.9120 |
| Previous Monthly Low | 0.8902 |
| Daily Fibonacci 38.2% | 0.8822 |
| Daily Fibonacci 61.8% | 0.8840 |
| Daily Pivot Point S1 | 0.8769 |
| Daily Pivot Point S2 | 0.8744 |
| Daily Pivot Point S3 | 0.8694 |
| Daily Pivot Point R1 | 0.8844 |
| Daily Pivot Point R2 | 0.8893 |
| Daily Pivot Point R3 | 0.8918 |
[/s2If]
Download Nehcap EAWe have two EAs that are operational on our LIVE accounts.
- EA-FIX: Check out the details here. Download EA-FIX . EA-FIX is a non-grid HFT scalper.
- EA-GROWTH: High quality low dd EA using trend grids. Download EA_GROWTHJoin Our Telegram Group
")


