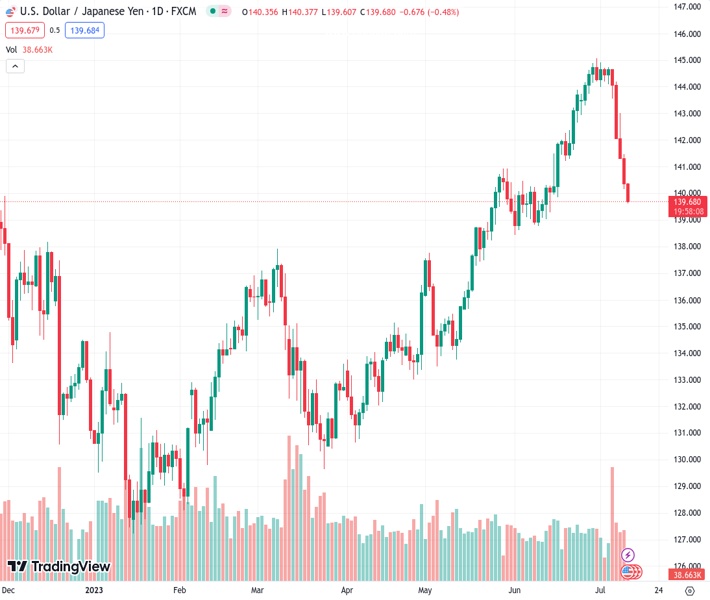
On Wednesday, the USDJPY currency pair continues to experience selling pressure for the fifth consecutive day, with a value of 139.733.
…
This is a premium post.
[s2If !current_user_can(access_s2member_level4)]Please register for FREE REGISTER to read full post below containing analysis. In case of any error or you think you are not able to read the full post below, please email us at support#nehcap.com [lwa][/s2If] [s2If current_user_can(access_s2member_level1)]
- USD/JPY remains under some selling pressure for the fifth straight day on Wednesday.
The pair currently trades last at 139.733.
The previous day high was 141.46 while the previous day low was 140.16. The daily 38.2% Fib levels comes at 140.66, expected to provide resistance. Similarly, the daily 61.8% fib level is at 140.96, expected to provide resistance.
The USD/JPY pair prolongs its recent sharp retracement slide from the YTD peak – levels just above the 145.00 psychological mark = and continues losing ground for the fifth successive day on Wednesday. Spot prices drop to a nearly one-month low during the Asian session and currently trade just above the 139.50 level, down nearly 0.50% for the day.
The Japanese Yen (JPY) continues to draw support from speculations that the Bank of Japan (BOJ) will adjust its ultra-loose policy settings as soon as this month, which has been pushing the Japanese Government Bond (JGB) yields higher. In fact, the benchmark 10-year JGB yield shot to its highest level since April earlier this week. This, along with the recent pullback in the US Treasury bond yields, narrows the US-Japan rate-differential and further contributes to driving flows towards the JPY. Apart from this, the prevailing US Dollar (USD) selling bias is seen as another factor exerting downward pressure on the USD/JPY pair.
In fact, the USD Index (DXY), which tracks the Greenback against a basket of currencies, hits a fresh two-month low in the wake of firming expectations that the Federal Reserve (Fed) has limited headroom to keep raising rates. Several Fed officials said on Monday the US central bank would likely tighten its monetary policy further to bring down inflation, though the end to its current rate-hiking cycle was getting close. The bets were reaffirmed by the New York Fed’s monthly survey released on Monday, which showed that the one-year consumer inflation expectation dropped to 3.8% in June – the lowest level since April 2021.
The aforementioned fundamental backdrop, meanwhile, suggests that the path of least resistance for the USD/JPY pair remains to the downside. Traders, however, might refrain from placing aggressive and prefer to wait on the sidelines ahead of the release of the latest US consumer inflation figures, due later during the early North American session. A furtehr slowdown in price growth is more likely to prompt fresh USD selling, paving the way for a further near-term deprecaiting move for the major. In contrast, any positive surprise might prompt aggressive short-covering move around the Greenback and the major.
Technical Levels: Supports and Resistances
USDJPY currently trading at 139.84 at the time of writing. Pair opened at 140.37 and is trading with a change of -0.38 % .
| Overview | Overview.1 | |
|---|---|---|
| 0 | Today last price | 139.84 |
| 1 | Today Daily Change | -0.53 |
| 2 | Today Daily Change % | -0.38 |
| 3 | Today daily open | 140.37 |
The pair is trading below its 20 Daily moving average @ 142.86, below its 50 Daily moving average @ 139.92 , above its 100 Daily moving average @ 136.92 and above its 200 Daily moving average @ 137.19
| Trends | Trends.1 | |
|---|---|---|
| 0 | Daily SMA20 | 142.86 |
| 1 | Daily SMA50 | 139.92 |
| 2 | Daily SMA100 | 136.92 |
| 3 | Daily SMA200 | 137.19 |
The previous day high was 141.46 while the previous day low was 140.16. The daily 38.2% Fib levels comes at 140.66, expected to provide resistance. Similarly, the daily 61.8% fib level is at 140.96, expected to provide resistance.
Note the levels of interest below:
- Pivot support is noted at 139.87, 139.36, 138.57
- Pivot resistance is noted at 141.17, 141.96, 142.47
| Levels | Levels.1 |
|---|---|
| Previous Daily High | 141.46 |
| Previous Daily Low | 140.16 |
| Previous Weekly High | 144.91 |
| Previous Weekly Low | 142.07 |
| Previous Monthly High | 145.07 |
| Previous Monthly Low | 138.43 |
| Daily Fibonacci 38.2% | 140.66 |
| Daily Fibonacci 61.8% | 140.96 |
| Daily Pivot Point S1 | 139.87 |
| Daily Pivot Point S2 | 139.36 |
| Daily Pivot Point S3 | 138.57 |
| Daily Pivot Point R1 | 141.17 |
| Daily Pivot Point R2 | 141.96 |
| Daily Pivot Point R3 | 142.47 |
[/s2If]
Download Nehcap EAWe have two EAs that are operational on our LIVE accounts.
- EA-FIX: Check out the details here. Download EA-FIX . EA-FIX is a non-grid HFT scalper.
- EA-GROWTH: High quality low dd EA using trend grids. Download EA_GROWTHJoin Our Telegram Group
")


