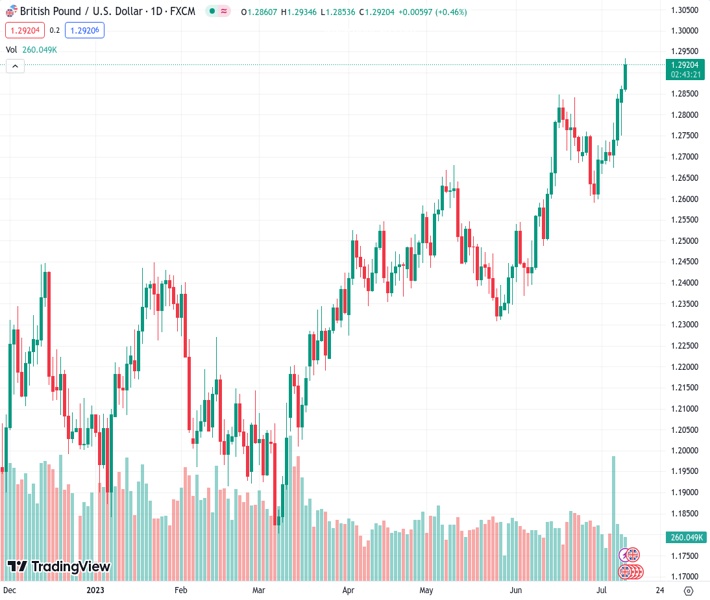
Analysts predict that the likelihood of a Bank of England (BoE) rate increase in August is higher due to an increase in UK wages, causing the GBP/USD currency pair to reach 1.29230.
…
This is a premium post.
[s2If !current_user_can(access_s2member_level4)]Please register for FREE REGISTER to read full post below containing analysis. In case of any error or you think you are not able to read the full post below, please email us at support#nehcap.com [lwa][/s2If] [s2If current_user_can(access_s2member_level1)]
- UK wage jump increases BoE rate hike chances, with analysts expecting a 50 bps hike in August.
The pair currently trades last at 1.29230.
The previous day high was 1.2868 while the previous day low was 1.275. The daily 38.2% Fib levels comes at 1.2823, expected to provide support. Similarly, the daily 61.8% fib level is at 1.2796, expected to provide support.
GBP/USD rallied to a 15-month high of 1.2934 after a solid employment report in the United Kingdom (UK) increased the chances the Bank of England (BoE) will need to raise rates further. That, alongside broad US Dollar (USD) weakness, underpinned the GBP/USD pair. The GBP/USD trades at 1.2923 after hitting a daily low of 1.2853.
UK’s May jobs report was mixed, as wages jumped by 7.3% YoY above estimates of 7.1% putting pressure on the Bank of England (BoE), with its Governor Andrew Bailey and Co looking forward to stirring inflation down from the 8.7% figure on May. Although wages suggest further tightening is needed, the rise in the unemployment rate to 4.0% from 3.8% in the three months to April tempered fears of a wage-price spiral.
The GBP/USD climbed towards 1.2900 on the data but failed to crack the latter on its first try. Later, the 1.29 figure gave In, exacerbating a rally to a new year-to-date (YTD) high, opening the door for a possible test of the 1.3000 figure in the near term.
Across the pond, a light economic docket in the United States (US) provided no support for the greenback, which extended its losses past the 102.000 figure per the US Dollar Index (DXY). US Treasury bond yields had reversed some of the last week’s gains, with investors bracing for US inflation data release.
The Consumer Price Index (CPI) for June is foreseen to fall to 3.1% YoY, from 4% in May, while month-over-month (MoM) is estimated at 0.3%, higher than May’s 0.1%. Excluding volatile items, the core CPI is estimated to cool down to 5% YoY from 5.3% in the last month. In comparison, MoM data is estimated at 0.3%, a downtick from the latest 0.4% readings during the previous two months.
Aside from this, words from the New York Fed President John Williams “signaled” the Fed will increase rates by a half percentage point more over the year. He added that supply and demand in the labor market are coming into better balance while adding a recession is not on his forecast.
Williams’s words, added to Monday’s comments by San Francisco’s Fed President Mary Daly suggesting that a couple of rate hikes are needed, might refrain GBP/USD traders from opening fresh bets on the pair.
The GBP/USD price action suggests the pair would extend its gains after reclaiming 1.2900. Following key resistance levels emerge at April 13 low-turned resistance at 1.2972 before testing 1.3000. A breach of the latter will expose the April 18, 2022, daily high at 1.3089 before challenging the 2021 yearly low of 1.3160. Contrarily. If GBP/USD drops below 1.2900, that could pave the way for further downside, with first support at June 19 daily high at 1.2837. Once cleared, the GBP/USD could dive towards the 20-day EMA at 1.2724.
Technical Levels: Supports and Resistances
GBPUSD currently trading at 1.292 at the time of writing. Pair opened at 1.2861 and is trading with a change of 0.46 % .
| Overview | Overview.1 | |
|---|---|---|
| 0 | Today last price | 1.2920 |
| 1 | Today Daily Change | 0.0059 |
| 2 | Today Daily Change % | 0.4600 |
| 3 | Today daily open | 1.2861 |
The pair remains strongly bullish on the daily timeframe. It trades above its 20 SMA @ 1.2732, 50 SMA 1.2581, 100 SMA @ 1.2421 and 200 SMA @ 1.2165.
| Trends | Trends.1 | |
|---|---|---|
| 0 | Daily SMA20 | 1.2732 |
| 1 | Daily SMA50 | 1.2581 |
| 2 | Daily SMA100 | 1.2421 |
| 3 | Daily SMA200 | 1.2165 |
The previous day high was 1.2868 while the previous day low was 1.275. The daily 38.2% Fib levels comes at 1.2823, expected to provide support. Similarly, the daily 61.8% fib level is at 1.2796, expected to provide support.
Note the levels of interest below:
- Pivot support is noted at 1.2785, 1.2709, 1.2667
- Pivot resistance is noted at 1.2903, 1.2945, 1.3021
| Levels | Levels.1 |
|---|---|
| Previous Daily High | 1.2868 |
| Previous Daily Low | 1.2750 |
| Previous Weekly High | 1.2850 |
| Previous Weekly Low | 1.2659 |
| Previous Monthly High | 1.2848 |
| Previous Monthly Low | 1.2369 |
| Daily Fibonacci 38.2% | 1.2823 |
| Daily Fibonacci 61.8% | 1.2796 |
| Daily Pivot Point S1 | 1.2785 |
| Daily Pivot Point S2 | 1.2709 |
| Daily Pivot Point S3 | 1.2667 |
| Daily Pivot Point R1 | 1.2903 |
| Daily Pivot Point R2 | 1.2945 |
| Daily Pivot Point R3 | 1.3021 |
[/s2If]
Download Nehcap EAWe have two EAs that are operational on our LIVE accounts.
- EA-FIX: Check out the details here. Download EA-FIX . EA-FIX is a non-grid HFT scalper.
- EA-GROWTH: High quality low dd EA using trend grids. Download EA_GROWTHJoin Our Telegram Group
")


