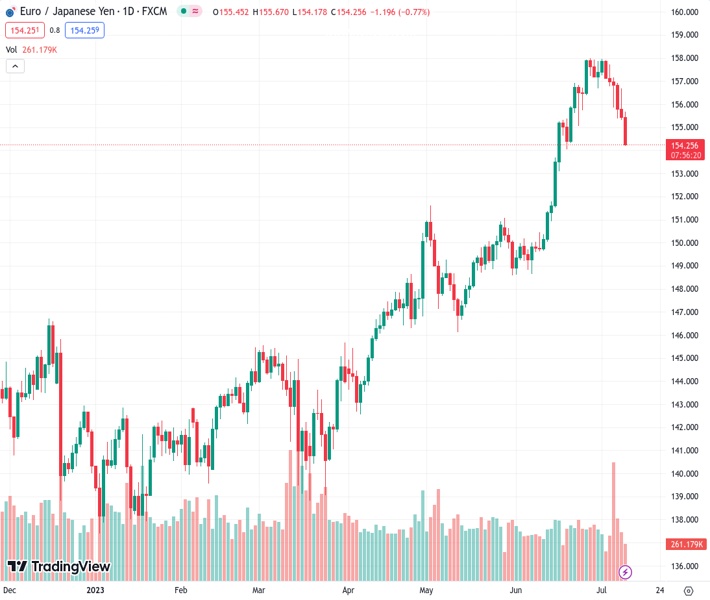
The EURJPY currency pair has dropped further to around the 154.00 area.
…
This is a premium post.
[s2If !current_user_can(access_s2member_level4)]Please register for FREE REGISTER to read full post below containing analysis. In case of any error or you think you are not able to read the full post below, please email us at support#nehcap.com [lwa][/s2If] [s2If current_user_can(access_s2member_level1)]
- EUR/JPY extends the decline to the vicinity of the 154.00 region.
The pair currently trades last at 154.283.
The previous day high was 156.67 while the previous day low was 155.33. The daily 38.2% Fib levels comes at 155.84, expected to provide resistance. Similarly, the daily 61.8% fib level is at 156.16, expected to provide resistance.
EUR/JPY accelerates its losses and trades at shouting distance from the 154.00 neighbourhood, or nearly 4-week lows, on Tuesday.
The cross extends further its monthly retracement and threatens to revisit the weekly low at 154.04 (June 20). The breach of this level could open the door to a deeper drop to, initially, the provisional 55-day SMA at 151.66.
The daily RSI around 48 still allows for the continuation of the downward move in the very near term.
So far, the longer term positive outlook for the cross appears favoured while above the 200-day SMA, today at 145.69.
Technical Levels: Supports and Resistances
EURJPY currently trading at 154.35 at the time of writing. Pair opened at 155.46 and is trading with a change of -0.71 % .
| Overview | Overview.1 | |
|---|---|---|
| 0 | Today last price | 154.35 |
| 1 | Today Daily Change | 149.00 |
| 2 | Today Daily Change % | -0.71 |
| 3 | Today daily open | 155.46 |
The pair is trading below its 20 Daily moving average @ 155.9, above its 50 Daily moving average @ 151.86 , above its 100 Daily moving average @ 148.26 and above its 200 Daily moving average @ 145.68
| Trends | Trends.1 | |
|---|---|---|
| 0 | Daily SMA20 | 155.90 |
| 1 | Daily SMA50 | 151.86 |
| 2 | Daily SMA100 | 148.26 |
| 3 | Daily SMA200 | 145.68 |
The previous day high was 156.67 while the previous day low was 155.33. The daily 38.2% Fib levels comes at 155.84, expected to provide resistance. Similarly, the daily 61.8% fib level is at 156.16, expected to provide resistance.
Note the levels of interest below:
- Pivot support is noted at 154.97, 154.48, 153.62
- Pivot resistance is noted at 156.32, 157.17, 157.66
| Levels | Levels.1 |
|---|---|
| Previous Daily High | 156.67 |
| Previous Daily Low | 155.33 |
| Previous Weekly High | 157.96 |
| Previous Weekly Low | 155.38 |
| Previous Monthly High | 158.00 |
| Previous Monthly Low | 148.62 |
| Daily Fibonacci 38.2% | 155.84 |
| Daily Fibonacci 61.8% | 156.16 |
| Daily Pivot Point S1 | 154.97 |
| Daily Pivot Point S2 | 154.48 |
| Daily Pivot Point S3 | 153.62 |
| Daily Pivot Point R1 | 156.32 |
| Daily Pivot Point R2 | 157.17 |
| Daily Pivot Point R3 | 157.66 |
[/s2If]
Download Nehcap EAWe have two EAs that are operational on our LIVE accounts.
- EA-FIX: Check out the details here. Download EA-FIX . EA-FIX is a non-grid HFT scalper.
- EA-GROWTH: High quality low dd EA using trend grids. Download EA_GROWTHJoin Our Telegram Group
")


