The USDCAD has increased slightly for two consecutive days, but there is not enough continued interest among buyers.
…
This is a premium post.
[s2If !current_user_can(access_s2member_level4)]Please register for FREE REGISTER to read full post below containing analysis. In case of any error or you think you are not able to read the full post below, please email us at support#nehcap.com [lwa][/s2If] [s2If current_user_can(access_s2member_level1)]
- USD/CAD ticks higher for the second straight day, albeit lacks follow-through buying.
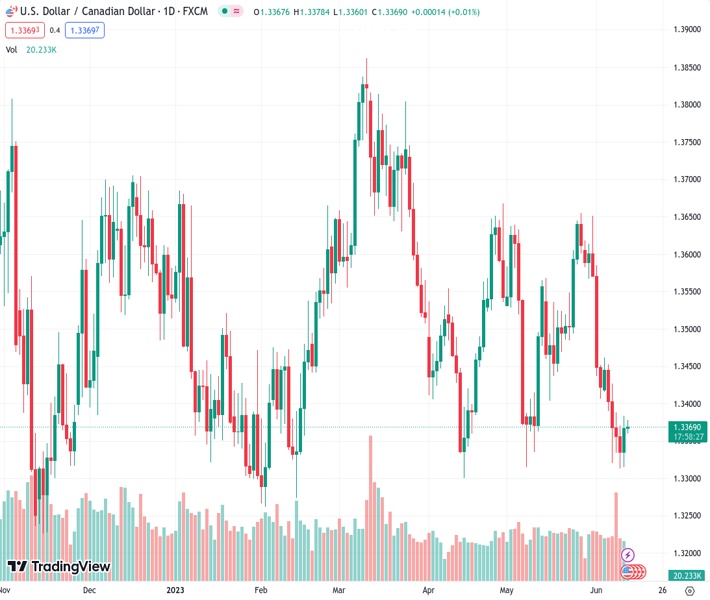
The pair currently trades last at 1.33710.
The previous day high was 1.3384 while the previous day low was 1.3315. The daily 38.2% Fib levels comes at 1.3357, expected to provide support. Similarly, the daily 61.8% fib level is at 1.3341, expected to provide support.
The USD/CAD pair gains some positive traction for the second successive day on Tuesday and looks to build on the overnight bounce from the 1.3315-1.3310 area, or a one-month low. The pair trades around the 1.3375 region during the Asian session, up less than 0.10% for the day, and draws support from the recent slump in Crude Oil prices.
Worries that a global economic slowdown, particularly in China, will dent fuel demand drag Crude Oil prices to the lowest level since early May on Monday, which, undermines the commodity-linked Loonie and acts as a tailwind for the USD/CAD pair. The upside, however, remains capped in the wake of a fresh US Dollar (USD), led by firming expectations that the Federal Reserve (Fed) will more likely skip hiking interest rates in June.
In fact, the recent dovish rhetoric by a slew of influential FOMC members reaffirmed market expectations about an imminent pause in the US central bank’s year-long policy tightening cycle. This represents a divergence in comparison to the Bank of Canada’s (BoC) surprise 25 bps rate hike last week, which might further contribute to capping gains for the USD/CAD pair and warrants some caution before placing aggressive bullish bets.
Traders might also prefer to wait on the sidelines ahead of the release of the latest US consumer inflation figures, due later during the early North American session. A stronger US CPI print will further lift bets for another 25 bps lift-off at the July FOMC meeting and provide a goodish lift to the buck. The immediate market reaction, however, is likely to remain limited ahead of the highly-anticipated Fed decision on Wednesday.
Apart from this, a modest downtick in the US Treasury bond yields might continue to act as a headwind for the Greenback. This further makes it prudent to wait for strong follow-through buying before confirming that the USD/CAD pair has formed a near-term bottom ahead of the 1.3300 mark and positioning for any meaningful appreciating move.
Technical Levels: Supports and Resistances
USDCAD currently trading at 1.3377 at the time of writing. Pair opened at 1.3368 and is trading with a change of 0.07 % .
| Overview | Overview.1 | |
|---|---|---|
| 0 | Today last price | 1.3377 |
| 1 | Today Daily Change | 0.0009 |
| 2 | Today Daily Change % | 0.0700 |
| 3 | Today daily open | 1.3368 |
The pair remains strongly bearish on the daily time frame. It trades below the 20 SMA @ 1.3487, 50 SMA 1.3486, 100 SMA @ 1.3515 and 200 SMA @ 1.3515.
| Trends | Trends.1 | |
|---|---|---|
| 0 | Daily SMA20 | 1.3487 |
| 1 | Daily SMA50 | 1.3486 |
| 2 | Daily SMA100 | 1.3515 |
| 3 | Daily SMA200 | 1.3515 |
The previous day high was 1.3384 while the previous day low was 1.3315. The daily 38.2% Fib levels comes at 1.3357, expected to provide support. Similarly, the daily 61.8% fib level is at 1.3341, expected to provide support.
Note the levels of interest below:
- Pivot support is noted at 1.3327, 1.3287, 1.3259
- Pivot resistance is noted at 1.3396, 1.3424, 1.3465
| Levels | Levels.1 |
|---|---|
| Previous Daily High | 1.3384 |
| Previous Daily Low | 1.3315 |
| Previous Weekly High | 1.3462 |
| Previous Weekly Low | 1.3313 |
| Previous Monthly High | 1.3655 |
| Previous Monthly Low | 1.3315 |
| Daily Fibonacci 38.2% | 1.3357 |
| Daily Fibonacci 61.8% | 1.3341 |
| Daily Pivot Point S1 | 1.3327 |
| Daily Pivot Point S2 | 1.3287 |
| Daily Pivot Point S3 | 1.3259 |
| Daily Pivot Point R1 | 1.3396 |
| Daily Pivot Point R2 | 1.3424 |
| Daily Pivot Point R3 | 1.3465 |
[/s2If]
Nehcap Expert Advisor
The NEHCAP MT4 EA is high quality professional trading system geared to generate returns without using GRID or martingales. Each trade has strict risk per trade parameter. The pairs under management include EURUSD, GBPUSD, AUDCAD, AUDNZD,GBPAUD, EURAUD, EURCAD, CHFJPY and many more.
The system is trading live: LIVE ACCOUNT TRACKING
You can run it free. Apply for a free trial and track our account. Buy the system or use profit share mechanism to generate returns on your MT4.
Join Our Telegram Group


