#NZDUSD @ 0.62623 takes offers to renew weekly low, extends the previous day’s pullback from five-week high., @nehcap view: Limited downside expected (Pivot Orderbook analysis)
…
This is a premium post.
[s2If !current_user_can(access_s2member_level4)]Please register for FREE REGISTER to read full post below containing analysis. In case of any error or you think you are not able to read the full post below, please email us at support#nehcap.com [lwa][/s2If] [s2If current_user_can(access_s2member_level1)]
- NZD/USD takes offers to renew weekly low, extends the previous day’s pullback from five-week high.
- RBNZ Inflation Expectations slump to 2.79% QoQ for Q2 2023 versus 3.30% prior.
- Downside break of 12-day-old ascending trend line, 50-SMA favors sellers.
- 200-SMA, nearly oversold RSI (14) line can prod the Kiwi pair bears.
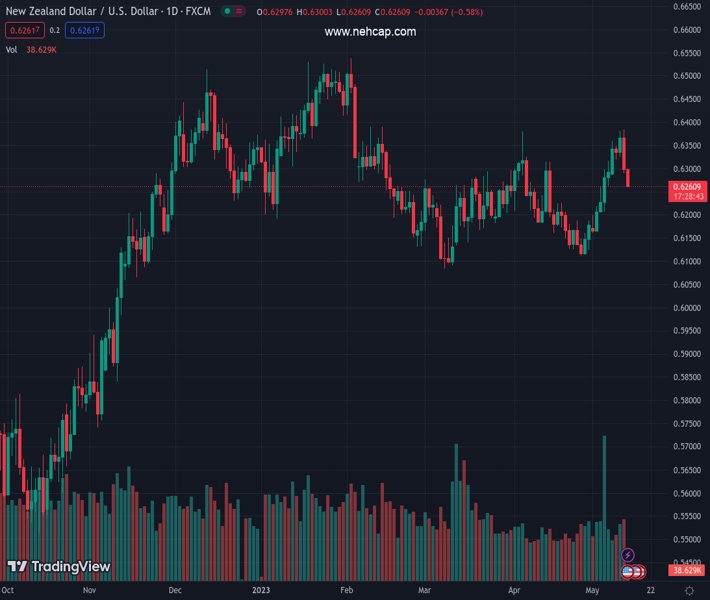
The pair currently trades last at 0.62623.
The previous day high was 0.6385 while the previous day low was 0.6289. The daily 38.2% Fib levels comes at 0.6326, expected to provide resistance. Similarly, the daily 61.8% fib level is at 0.6348, expected to provide resistance.
NZD/USD stands on slippery grounds as it takes offers to extend the previous day’s U-turn from the monthly high to renew the weekly low around 0.6260 during early Friday. In doing so, the Kiwi pair justifies disappointing inflation clues from amid broad US Dollar strength to break the short-term key technical supports.
Reserve Bank of New Zealand’s (RBNZ) Inflation Expectations for the second quarter (Q2) of 2023 dropped to the lowest levels since the Q3 of 2021 while falling to 2.79% versus 3.30% previous readings. Earlier in the day, New Zealand’s Business NZ PMI for April dropped to 49.1 versus 50.7 expected and 48.1 prior whereas Visitor Arrivals eased to 805% in March versus prior growth of 4,998%.
With this, the Kiwi pair broke an upward-sloping trend line from late April and the 50-SMA, respectively near 0.6300 and 0.6290.
Apart from the NZ data and downside break of the technical supports, the bearish MACD signals also favor the NZD/USD sellers to renew the weekly low near 0.6260.
However, the nearly oversold RSI conditions highlight the 200-SMA level of around 0.6230 as short-term key support to watch for the Kiwi pair bears.
Should the quote fails to respect the 0.6230 support, the 0.6200 round figure and the late April swing high around 0.6190 will be in the spotlight.
On the contrary, the 50-SMA and the previous support line, near 0.6290 and 0.6300 in that order, guard immediate recovery moves of the NZD/USD pair.
Following that, a one-month-old horizontal resistance area near 0.6315 and double tops marked near 0.6385 appear crucial to watch for the NZD/USD bulls.
Trend: Limited downside expected
Technical Levels: Supports and Resistances
NZDUSD currently trading at 0.6266 at the time of writing. Pair opened at 0.6298 and is trading with a change of -0.51 % .
| Overview | Overview.1 | |
|---|---|---|
| 0 | Today last price | 0.6266 |
| 1 | Today Daily Change | -0.0032 |
| 2 | Today Daily Change % | -0.5100 |
| 3 | Today daily open | 0.6298 |
The pair is trading above its 20 Daily moving average @ 0.6218, above its 50 Daily moving average @ 0.622 , below its 100 Daily moving average @ 0.628 and above its 200 Daily moving average @ 0.6161
| Trends | Trends.1 | |
|---|---|---|
| 0 | Daily SMA20 | 0.6218 |
| 1 | Daily SMA50 | 0.6220 |
| 2 | Daily SMA100 | 0.6280 |
| 3 | Daily SMA200 | 0.6161 |
The previous day high was 0.6385 while the previous day low was 0.6289. The daily 38.2% Fib levels comes at 0.6326, expected to provide resistance. Similarly, the daily 61.8% fib level is at 0.6348, expected to provide resistance.
Note the levels of interest below:
- Pivot support is noted at 0.6263, 0.6228, 0.6167
- Pivot resistance is noted at 0.6359, 0.642, 0.6455
| Levels | Levels.1 |
|---|---|
| Previous Daily High | 0.6385 |
| Previous Daily Low | 0.6289 |
| Previous Weekly High | 0.6316 |
| Previous Weekly Low | 0.6160 |
| Previous Monthly High | 0.6389 |
| Previous Monthly Low | 0.6111 |
| Daily Fibonacci 38.2% | 0.6326 |
| Daily Fibonacci 61.8% | 0.6348 |
| Daily Pivot Point S1 | 0.6263 |
| Daily Pivot Point S2 | 0.6228 |
| Daily Pivot Point S3 | 0.6167 |
| Daily Pivot Point R1 | 0.6359 |
| Daily Pivot Point R2 | 0.6420 |
| Daily Pivot Point R3 | 0.6455 |
[/s2If]
Nehcap Expert Advisor
The NEHCAP MT4 EA is high quality professional trading system geared to generate returns without using GRID or martingales. Each trade has strict risk per trade parameter. The pairs under management include EURUSD, GBPUSD, AUDCAD, AUDNZD,GBPAUD, EURAUD, EURCAD, CHFJPY and many more.
The system is trading live: LIVE ACCOUNT TRACKING
You can run it free. Apply for a free trial and track our account. Buy the system or use profit share mechanism to generate returns on your MT4.
Join Our Telegram Group
")


