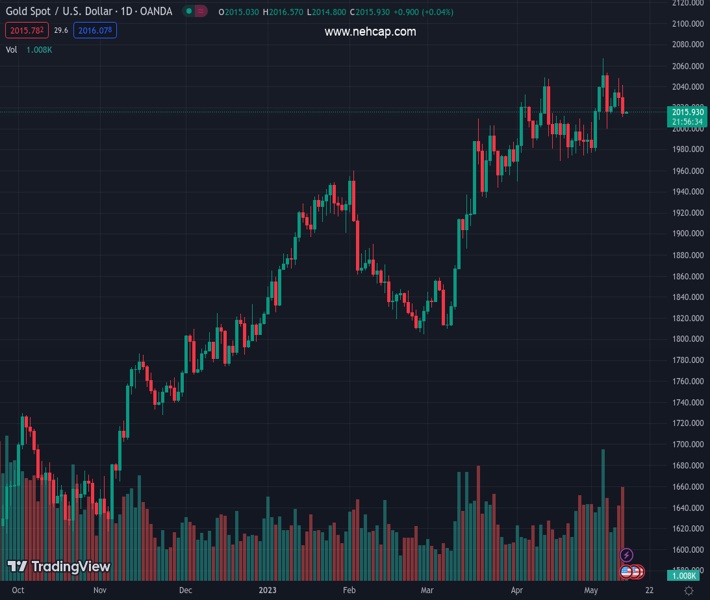
#XAUUSD @ 2,015.37 Gold price appears all-set for the first weekly loss in three after posting two-day downtrend in the last., @nehcap view: Limited downside expected (Pivot Orderbook analysis)
…
This is a premium post.
[s2If !current_user_can(access_s2member_level4)]Please register for FREE REGISTER to read full post below containing analysis. In case of any error or you think you are not able to read the full post below, please email us at support#nehcap.com [lwa][/s2If] [s2If current_user_can(access_s2member_level1)]
- Gold price appears all-set for the first weekly loss in three after posting two-day downtrend in the last.
- Fears of United States default, banking fallouts join downbeat data to weigh on risk appetite and XAU/USD.
- US Dollar Index ignores mixed Producer Price Index, Jobless Claims and Treasury bond yields to remain firmer.
- US Michigan Consumer Sentiment Index, Consumer Inflation Expectations eyed for clear Gold price directions.
The pair currently trades last at 2015.37.
The previous day high was 2048.27 while the previous day low was 2021.59. The daily 38.2% Fib levels comes at 2031.78, expected to provide resistance. Similarly, the daily 61.8% fib level is at 2038.08, expected to provide resistance.
Gold price (XAU/USD) licks its wounds around $2,015 amid the early Asian session on Friday, after declining in the last two consecutive days. In doing so, the precious metal bears the burden of the market’s risk-off mood, which in turn underpins the US Dollar demand, while preparing for the first weekly loss in three. Among the main culprits, fears of the United States default and mixed US data, mostly downbeat, seem to have weighed on the sentiment and the XAU/USD.
Gold price remained pressured on Thursday for the second consecutive day despite the softer United States economics. The reason could be linked to the market’s rush towards the US Dollar amid fears of the US debt ceiling expiry and banking fallouts.
Among the latest negatives on the matter is the postponement of the debt ceiling talks between US President Joe Biden and House Speaker McCarthy. “A debt limit meeting between US President Joe Biden and top lawmakers that had been scheduled for Friday has been postponed, and the leaders agreed to meet early next week, a White House spokesperson said on Thursday,” reported Reuters.
The news becomes all the more important and negatively impacts the risk appetite as the US Treasury Department has already signaled the Federal Government’s likely default as soon as June 1 unless the debt ceiling is raised. Also increasing the intensity of the news is the fact that US President Biden is set to attend the G7 meeting in Japan the next week.
Previously, US Treasury Secretary Janet Yellen reiterated her warning that the “US default would threaten US recovery, sparking a global downturn that would set us back much further,” on early Thursday. On the same line was Beth Hammack, Chair of the Treasury Borrowing Advisory Committee and Co-Head of Goldman’s Global Financing Group, who said recently that a political deadlock over the US debt ceiling poses a “real risk” for the USD.
On the other hand, Reuters’ news said that around 113 of the largest U.S. lenders will bear the cost of replenishing a deposit insurance fund that was drained of $16 billion by recent bank failures, per the Federal Deposit Insurance Corporation (FDIC).
Apart from the fears emanating from the US debt-ceiling expiration and banking woes, the likely stronger return of the US-China tension also weighs on the market sentiment and the Gold price. On Thursday, US Treasury Secretary Janet Yellen said that the Biden administration has been discussing restrictions on outbound investment to China for some time. Earlier in the week, China’s Foreign Ministry reiterated its dislike for the US intervention in the Taiwan issue.
While portraying the mood, Wall Street edged lower whereas the US 10-year and two-year Treasury bond yields also dropped in the last two consecutive days, which in turn allowed the US Dollar Index to print a two-day winning streak to 102.07 at the latest.
While the risk-off mood allowed the US Dollar Index (DXY) to remain firmer, the United States statistics weren’t helping the greenback. After a softer US Consumer Price Index (CPI), the Producer Price Index (PPI) improved to 0.2% MoM for April versus 0.3% expected and -0.4% prior. More importantly, PPI ex Food & Energy, known as Core PPI, rose on MoM but eased on YoY. Further, US Initial Jobless Claims rose by 264,000 to push the level to the highest level since October 2021, which in turn escalated the risk-off mood and favored the US Dollar.
Following the data, Minneapolis Fed President Neel Kashkari mentioned on Thursday that inflation has eased but warned it is above the Fed’s 2% target while speaking at the Marquette CEO Town Hall in Michigan.
It’s worth noting that the mixed US data and Fed talks failed to prod the US Dollar bulls and rather weighed on the Gold price by raising market fears. Amid these plays, the Fed Fund Futures keep suggesting a pause in the Federal Reserve rate hikes before the rate cuts begin in September 2023.
Moving on, the Gold traders may seek more clues to direct the latest downturn, which in turn highlights updates on the US debt ceiling and banking fronts. Additionally important will be the preliminary readings of the University of Michigan’s (UoM) Consumer Sentiment Index (CSI) for May, as well as the UoM 5-year Consumer Inflation Expectations for the said month.
Gold price confirmed pennant breakdown on Thursday, suggesting the metal’s further downside. The metal’s bearish break also justifies downbeat signals from Moving Average Convergence and Divergence (MACD) indicator, as well as the steady Relative Strength Index (RSI) line, placed at 14.
With this, the XAU/USD appears well set to prod the 200-bar Exponential Moving Average (EMA), close to $1,993 by the press time.
In a case where the Gold price remains bearish past $1,993, the mid-March swing high surrounding $1,937 and the $1,900 round figure could lure the XAU/USD sellers.
On the flip side, the stated pennant’s upper line, close to $2,042 at the latest, guards the immediate recovery of the Gold price.
Following that, $2,050 and the recently flashed record high of near $2,080 can attract the XAU/USD bids. It’s worth observing, however, that an upward-sloping resistance line from March 20, around $2,090, quickly followed by the $2,100 round figure may challenge further upside of the Gold price.
To sum up, Gold price appears well-set for further downside but the road towards the south appears long and bumpy.
Trend: Limited downside expected
Technical Levels: Supports and Resistances
XAUUSD currently trading at 2015.8 at the time of writing. Pair opened at 2029.98 and is trading with a change of -0.70% % .
| Overview | Overview.1 | |
|---|---|---|
| 0 | Today last price | 2015.8 |
| 1 | Today Daily Change | -14.18 |
| 2 | Today Daily Change % | -0.70% |
| 3 | Today daily open | 2029.98 |
The pair remains strongly bullish on the daily timeframe. It trades above its 20 SMA @ 2008.57, 50 SMA 1965.38, 100 SMA @ 1915.76 and 200 SMA @ 1818.6.
| Trends | Trends.1 | |
|---|---|---|
| 0 | Daily SMA20 | 2008.57 |
| 1 | Daily SMA50 | 1965.38 |
| 2 | Daily SMA100 | 1915.76 |
| 3 | Daily SMA200 | 1818.60 |
The previous day high was 2048.27 while the previous day low was 2021.59. The daily 38.2% Fib levels comes at 2031.78, expected to provide resistance. Similarly, the daily 61.8% fib level is at 2038.08, expected to provide resistance.
Note the levels of interest below:
- Pivot support is noted at 2018.29, 2006.6, 1991.61
- Pivot resistance is noted at 2044.97, 2059.96, 2071.65
| Levels | Levels.1 |
|---|---|
| Previous Daily High | 2048.27 |
| Previous Daily Low | 2021.59 |
| Previous Weekly High | 2079.76 |
| Previous Weekly Low | 1977.12 |
| Previous Monthly High | 2048.75 |
| Previous Monthly Low | 1949.83 |
| Daily Fibonacci 38.2% | 2031.78 |
| Daily Fibonacci 61.8% | 2038.08 |
| Daily Pivot Point S1 | 2018.29 |
| Daily Pivot Point S2 | 2006.60 |
| Daily Pivot Point S3 | 1991.61 |
| Daily Pivot Point R1 | 2044.97 |
| Daily Pivot Point R2 | 2059.96 |
| Daily Pivot Point R3 | 2071.65 |
[/s2If]
Nehcap Expert Advisor
The NEHCAP MT4 EA is high quality professional trading system geared to generate returns without using GRID or martingales. Each trade has strict risk per trade parameter. The pairs under management include EURUSD, GBPUSD, AUDCAD, AUDNZD,GBPAUD, EURAUD, EURCAD, CHFJPY and many more.
The system is trading live: LIVE ACCOUNT TRACKING
You can run it free. Apply for a free trial and track our account. Buy the system or use profit share mechanism to generate returns on your MT4.
Join Our Telegram Group
")


