#EURUSD @ 1.09154 drops to 1.0916 as US PPI data slows and unemployment claims rise, strengthening the US Dollar. (Pivot Orderbook analysis)
…
This is a premium post.
[s2If !current_user_can(access_s2member_level4)]Please register for FREE REGISTER to read full post below containing analysis. In case of any error or you think you are not able to read the full post below, please email us at support#nehcap.com [lwa][/s2If] [s2If current_user_can(access_s2member_level1)]
- EUR/USD drops to 1.0916 as US PPI data slows and unemployment claims rise, strengthening the US Dollar.
- US Treasury bond yields fall with investors pricing in three rate cuts by the Federal Reserve by December 2023.
- ECB speakers emphasize slowing inflation in the Eurozone, with further rate hikes left on the table.
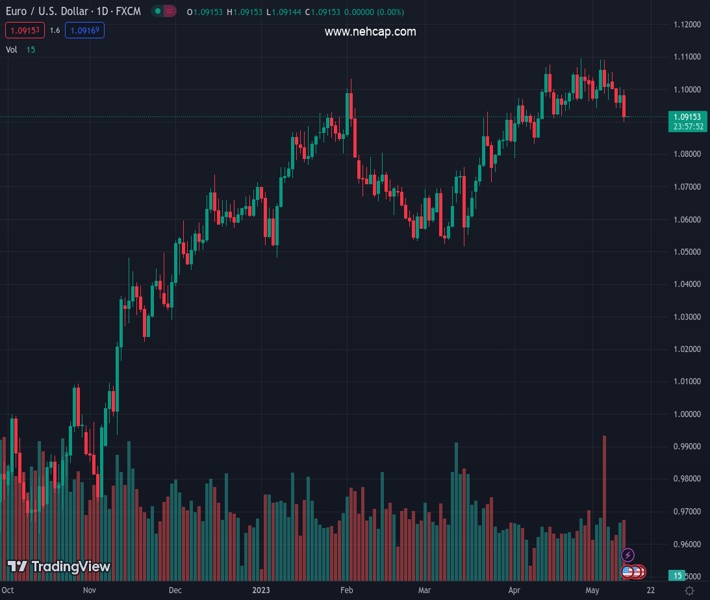
The pair currently trades last at 1.09154.
The previous day high was 1.1007 while the previous day low was 1.0942. The daily 38.2% Fib levels comes at 1.0982, expected to provide resistance. Similarly, the daily 61.8% fib level is at 1.0966, expected to provide resistance.
EUR/USD enjoyed an upbeat beginning of the week, but Thursday’s session sent the EUR/USD pair plummeting to new four-week-lows at around 1.0899. The main reason for a strong US Dollar (USD) amidst falling US bond yields as inflation data continues to slow down, while a rise in unemployment claims suggests the labor market is easing. The EUR/USD is trading at 1.0916, nearly the weekly lows, down more than 0.50%.
The US Department of Labor revealed inflation data on the producer side, known as the Producer Price Index (PPI) for April, with headline and core PPI slowing 0.01% lower in yearly data, while monthly readings in both cases stood at 0.4%. Although data was negative for the US Dollar and positive for the Euro (EUR), traders booked profits per the EUR/USD reaction; simultaneously, the pair sank below the 20-day EMA, sitting at 1.0972.
In other data, Initial Jobless Claims climbed above the 245K estimates for the week ending May 6 and rose by 264K, as the Minnesota Fed President Neil Kashkari crossed newswires. He said that albeit inflation is cooling, it remains stickier. He added, “We will have to keep at it for an extended period.”
After the data release, US Treasury bond yields edged lower as investors began to price three 25 bps rate cuts by the US Federal Reserve toward the December 2023 meeting, according to the CME FedWatch Tool. The US 2s and 10-year bond yields continued to register losses of one and a half bps, respectively, at 3.897% and 3.386%, respectively.
On the Eurozone (EU) front, European Central Bank (ECB) speakers continued to stress that inflation is slowing down, as ECB de Cos commented that the EU’s central bank is closed to its final cycle of hiking interest. The ECB’s Vice-President De Guindos echoes de Cos’ comments on inflation but leaves the door open to further rate hikes.
The Eurozone economic docket will feature inflation data in France, and Spain, alongside Germany’s Current Account. ECB’s Luis De Guindos will cross newswires. On the US front, the University of Michigan Consumer Sentiment, alongside Federal Reserve speakers.
Technical Levels: Supports and Resistances
EURUSD currently trading at 1.0915 at the time of writing. Pair opened at 1.0982 and is trading with a change of -0.61 % .
| Overview | Overview.1 | |
|---|---|---|
| 0 | Today last price | 1.0915 |
| 1 | Today Daily Change | -0.0067 |
| 2 | Today Daily Change % | -0.6100 |
| 3 | Today daily open | 1.0982 |
The pair is trading below its 20 Daily moving average @ 1.0999, above its 50 Daily moving average @ 1.0861 , above its 100 Daily moving average @ 1.0793 and above its 200 Daily moving average @ 1.0446
| Trends | Trends.1 | |
|---|---|---|
| 0 | Daily SMA20 | 1.0999 |
| 1 | Daily SMA50 | 1.0861 |
| 2 | Daily SMA100 | 1.0793 |
| 3 | Daily SMA200 | 1.0446 |
The previous day high was 1.1007 while the previous day low was 1.0942. The daily 38.2% Fib levels comes at 1.0982, expected to provide resistance. Similarly, the daily 61.8% fib level is at 1.0966, expected to provide resistance.
Note the levels of interest below:
- Pivot support is noted at 1.0947, 1.0912, 1.0882
- Pivot resistance is noted at 1.1012, 1.1042, 1.1078
| Levels | Levels.1 |
|---|---|
| Previous Daily High | 1.1007 |
| Previous Daily Low | 1.0942 |
| Previous Weekly High | 1.1092 |
| Previous Weekly Low | 1.0942 |
| Previous Monthly High | 1.1095 |
| Previous Monthly Low | 1.0788 |
| Daily Fibonacci 38.2% | 1.0982 |
| Daily Fibonacci 61.8% | 1.0966 |
| Daily Pivot Point S1 | 1.0947 |
| Daily Pivot Point S2 | 1.0912 |
| Daily Pivot Point S3 | 1.0882 |
| Daily Pivot Point R1 | 1.1012 |
| Daily Pivot Point R2 | 1.1042 |
| Daily Pivot Point R3 | 1.1078 |
[/s2If]
Nehcap Expert Advisor
The NEHCAP MT4 EA is high quality professional trading system geared to generate returns without using GRID or martingales. Each trade has strict risk per trade parameter. The pairs under management include EURUSD, GBPUSD, AUDCAD, AUDNZD,GBPAUD, EURAUD, EURCAD, CHFJPY and many more.
The system is trading live: LIVE ACCOUNT TRACKING
You can run it free. Apply for a free trial and track our account. Buy the system or use profit share mechanism to generate returns on your MT4.
Join Our Telegram Group
")


