#NZDUSD @ 0.62958 drops to 0.6298 as US Dollar demand surges amidst an easing labor market and decelerating PPI figures. (Pivot Orderbook analysis)
…
This is a premium post.
[s2If !current_user_can(access_s2member_level4)]Please register for FREE REGISTER to read full post below containing analysis. In case of any error or you think you are not able to read the full post below, please email us at support#nehcap.com [lwa][/s2If] [s2If current_user_can(access_s2member_level1)]
- NZD/USD drops to 0.6298 as US Dollar demand surges amidst an easing labor market and decelerating PPI figures.
- Weaker Chinese inflation data and factory activity contraction impact NZD, seen as a proxy for the Chinese economy.
- Investors monitor US debt ceiling discussions as Biden resumes talks with Congress leaders on Friday.
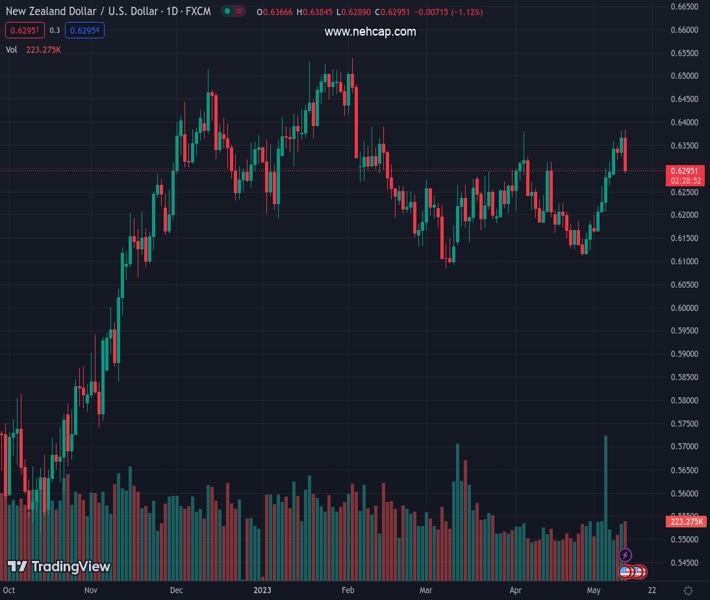
The pair currently trades last at 0.62958.
The previous day high was 0.6381 while the previous day low was 0.6324. The daily 38.2% Fib levels comes at 0.6359, expected to provide resistance. Similarly, the daily 61.8% fib level is at 0.6346, expected to provide resistance.
NZD/USD dropped from around weekly highs in the North American session after US data painted a gloomy economic outlook but triggered demand for the US Dollar (USD) as risk aversion hit the FX space. US Treasury bond yields are down as investors price 75 bps of rate cuts by December 2023. The NZD/USD is trading at 0.6298, down more than 1%.
A strong USD dented the prospects of the New Zealand Dollar (NZD), which weakened due to some reasons. Weaker inflation data in China prompted worries about the growth pace in one of Asia’s largest economies. Nevertheless, China’s contraction in factory activity, and imports falling, weighed on the NZD, which is seen as well as the Aussie Dollar (AUD) as a proxy for the Chinese economy.
On the USD front, data from the United States (US) showed that the labor market is easing, as unemployment claims climbed to 264K, above the 245K expected. At the same time, the Producer Price Index (PPI) in April decelerated to 2.3% YoY, the same as the core PPI, which rose by 3.2% YoY, with both figures below forecasts.
After the data release, the NZD/USD dived from around 0.6340s, toward the 0.6300 figure, before extending its losses late in the New York session. In the meantime, the US Dollar Index (DXY), a gauge that measures the buck’s value against six currencies, prints a new one-week high at around 102.153, up by 0.67%.
On the Fed speaker front, Minnesota’s Fed President Neil Kashkari held to his “hawkish” rhetoric, stating that inflation is coming down. Still, as it remains persistent, “We will have to keep at it for an extended period.”
Investors are also watching the discussions regarding the US debt ceiling, which did not progress as expected. US President Joe Biden would resume talks with US Congress leaders on Friday.
The New Zealand economic docket will feature the Business Inflation Expectations for Q2, the Business PMI for April, and Visitor Arrivals. The US Trade of Balance and the University of Michigan Consumer Sentiment poll would be reported on the US agenda, alongside further Fed speaking.
Technical Levels: Supports and Resistances
NZDUSD currently trading at 0.6294 at the time of writing. Pair opened at 0.6367 and is trading with a change of -1.15 % .
| Overview | Overview.1 | |
|---|---|---|
| 0 | Today last price | 0.6294 |
| 1 | Today Daily Change | -0.0073 |
| 2 | Today Daily Change % | -1.1500 |
| 3 | Today daily open | 0.6367 |
The pair remains strongly bullish on the daily timeframe. It trades above its 20 SMA @ 0.6217, 50 SMA 0.6219, 100 SMA @ 0.6279 and 200 SMA @ 0.6161.
| Trends | Trends.1 | |
|---|---|---|
| 0 | Daily SMA20 | 0.6217 |
| 1 | Daily SMA50 | 0.6219 |
| 2 | Daily SMA100 | 0.6279 |
| 3 | Daily SMA200 | 0.6161 |
The previous day high was 0.6381 while the previous day low was 0.6324. The daily 38.2% Fib levels comes at 0.6359, expected to provide resistance. Similarly, the daily 61.8% fib level is at 0.6346, expected to provide resistance.
Note the levels of interest below:
- Pivot support is noted at 0.6333, 0.63, 0.6276
- Pivot resistance is noted at 0.6391, 0.6415, 0.6448
| Levels | Levels.1 |
|---|---|
| Previous Daily High | 0.6381 |
| Previous Daily Low | 0.6324 |
| Previous Weekly High | 0.6316 |
| Previous Weekly Low | 0.6160 |
| Previous Monthly High | 0.6389 |
| Previous Monthly Low | 0.6111 |
| Daily Fibonacci 38.2% | 0.6359 |
| Daily Fibonacci 61.8% | 0.6346 |
| Daily Pivot Point S1 | 0.6333 |
| Daily Pivot Point S2 | 0.6300 |
| Daily Pivot Point S3 | 0.6276 |
| Daily Pivot Point R1 | 0.6391 |
| Daily Pivot Point R2 | 0.6415 |
| Daily Pivot Point R3 | 0.6448 |
[/s2If]
Nehcap Expert Advisor
The NEHCAP MT4 EA is high quality professional trading system geared to generate returns without using GRID or martingales. Each trade has strict risk per trade parameter. The pairs under management include EURUSD, GBPUSD, AUDCAD, AUDNZD,GBPAUD, EURAUD, EURCAD, CHFJPY and many more.
The system is trading live: LIVE ACCOUNT TRACKING
You can run it free. Apply for a free trial and track our account. Buy the system or use profit share mechanism to generate returns on your MT4.
Join Our Telegram Group
")


