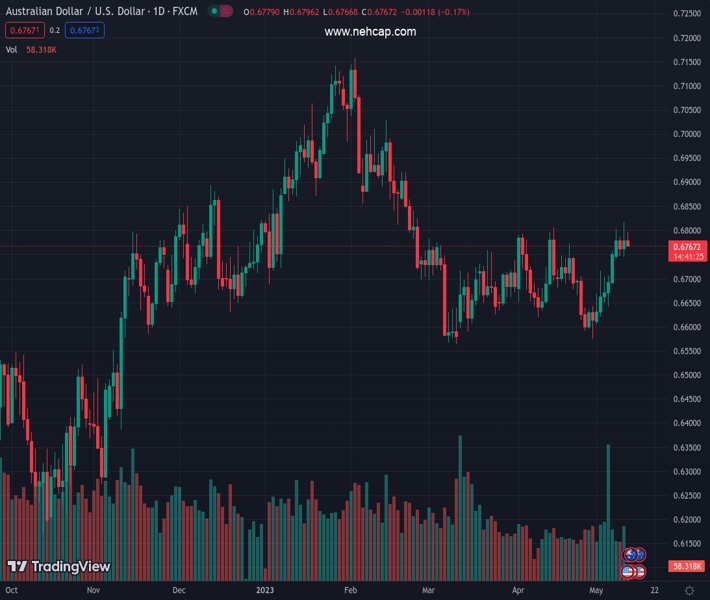
#AUDUSD @ 0.67708 lacks any firm intraday direction and oscillates in a range on Thursday. (Pivot Orderbook analysis)
…
This is a premium post.
[s2If !current_user_can(access_s2member_level4)]Please register for FREE REGISTER to read full post below containing analysis. In case of any error or you think you are not able to read the full post below, please email us at support#nehcap.com [lwa][/s2If] [s2If current_user_can(access_s2member_level1)]
- AUD/USD lacks any firm intraday direction and oscillates in a range on Thursday.
- Mixed Chinese inflation data is seen capping gains amid a modest USD strength.
- Bulls still need to wait for a move beyond the 100 DMA before placing fresh bets.
The pair currently trades last at 0.67708.
The previous day high was 0.6818 while the previous day low was 0.6744. The daily 38.2% Fib levels comes at 0.679, expected to provide resistance. Similarly, the daily 61.8% fib level is at 0.6773, expected to provide resistance.
The AUD/USD pair continues with its struggle to make it through the 100-day Simple Moving Average (SMA) and seesaws between tepid gains/minor losses, below the 0.6800 mark through the Asian session on Thursday. The pair, however, remains well within the striking distance of its highest level since February 24, around the 0.6815-0.6820 region touched the previous day.
Mixed Chinese inflation figures published early today, along with a modest US Dollar (USD) uptick, act as a headwind for the AUD/USD pair. In fact, the National Bureau of Statistics (NBS) reported that the headline CPI in China rose by 0.1% rate in April, marking a sharp deceleration from the 0.7% annual rise seen in the previous month and the lowest rate since February 2021. This indicated that domestic demand remains lacklustre. Adding to this, China’s Producer Price Index fell for the seventh straight month, by 3.6% year-on-year during the reported month, and fueled worries about economic health.
That said, the Reserve Bank of Australia’s (RBA) hawkish outlook, indicating that some further tightening of monetary policy may be required to ensure that inflation returns to target in a reasonable time, limits the downside for the Aussie. Apart from this, growing acceptance that the Federal Reserve (Fed) is nearing the end of its rate-hiking cycles keeps a lid on any meaningful upside for the USD and continues to lend some support to the AUD/USD pair. The market expectations were reaffirmed by the release of the crucial US CPI on Wednesday, which pointed to further signs of easing inflationary pressures.
The aforementioned fundamental backdrop seems tilted firmly in favour of bullish traders and suggests that the path of least resistance for the AUD/USD pair is to the upside. That said, the recent repeated failures to find acceptance above the 100-day SMA make it prudent to wait for strong follow-through buying before positioning for any further near-term appreciating move. Market participants now look to the US economic docket, featuring the release of the Producer Price Index (PPI) and the usual Weekly Initial Jobless Claims data, for a fresh impetus later during the early North American session.
Technical Levels: Supports and Resistances
AUDUSD currently trading at 0.6776 at the time of writing. Pair opened at 0.678 and is trading with a change of -0.06 % .
| Overview | Overview.1 | |
|---|---|---|
| 0 | Today last price | 0.6776 |
| 1 | Today Daily Change | -0.0004 |
| 2 | Today Daily Change % | -0.0600 |
| 3 | Today daily open | 0.6780 |
The pair is trading above its 20 Daily moving average @ 0.6698, above its 50 Daily moving average @ 0.6686 , below its 100 Daily moving average @ 0.6791 and above its 200 Daily moving average @ 0.6726
| Trends | Trends.1 | |
|---|---|---|
| 0 | Daily SMA20 | 0.6698 |
| 1 | Daily SMA50 | 0.6686 |
| 2 | Daily SMA100 | 0.6791 |
| 3 | Daily SMA200 | 0.6726 |
The previous day high was 0.6818 while the previous day low was 0.6744. The daily 38.2% Fib levels comes at 0.679, expected to provide resistance. Similarly, the daily 61.8% fib level is at 0.6773, expected to provide resistance.
Note the levels of interest below:
- Pivot support is noted at 0.6743, 0.6707, 0.6669
- Pivot resistance is noted at 0.6817, 0.6855, 0.6891
| Levels | Levels.1 |
|---|---|
| Previous Daily High | 0.6818 |
| Previous Daily Low | 0.6744 |
| Previous Weekly High | 0.6757 |
| Previous Weekly Low | 0.6607 |
| Previous Monthly High | 0.6806 |
| Previous Monthly Low | 0.6574 |
| Daily Fibonacci 38.2% | 0.6790 |
| Daily Fibonacci 61.8% | 0.6773 |
| Daily Pivot Point S1 | 0.6743 |
| Daily Pivot Point S2 | 0.6707 |
| Daily Pivot Point S3 | 0.6669 |
| Daily Pivot Point R1 | 0.6817 |
| Daily Pivot Point R2 | 0.6855 |
| Daily Pivot Point R3 | 0.6891 |
[/s2If]
Nehcap Expert Advisor
The NEHCAP MT4 EA is high quality professional trading system geared to generate returns without using GRID or martingales. Each trade has strict risk per trade parameter. The pairs under management include EURUSD, GBPUSD, AUDCAD, AUDNZD,GBPAUD, EURAUD, EURCAD, CHFJPY and many more.
The system is trading live: LIVE ACCOUNT TRACKING
You can run it free. Apply for a free trial and track our account. Buy the system or use profit share mechanism to generate returns on your MT4.
Join Our Telegram Group
")


